怎样用python进行K-means图片聚类
直接附代码:
import os, codecs
import shutil
import matplotlib.pyplot as plt
import cv2
import numpy as np
from sklearn.cluster import KMeans
from scipy.spatial.distance import cdist

def get_file_name(path):
    '''''
    Args: path to list;  Returns: path with filenames
    '''
    filenames = os.listdir(path)
    path_filenames = []
    filename_list = []
    for file in filenames:
        if not file.startswith('.'):
            path_filenames.append(os.path.join(path, file))
            filename_list.append(file)

    return path_filenames


def knn_detect(file_list, cluster_nums, randomState=True):
    features = []
    files = file_list

    # sift = cv2.xfeatures2d.SIFT_create()
    for file in files:
        # print(file)
        img = cv2.imread(file)
        """
        采用插值的方式进行resize images size,
        calculate each image hist feature,
        normalize
        """
        img = cv2.resize(img, (64, 64), interpolation=cv2.INTER_CUBIC)

        #第一种特征提取方法
        # nhist = cv2.calcHist([img], [0,1], None, [64,64], [0.0, 255.0,0.0, 255.0])
        # # 归一化,分为范围归一化和值归一化,如下是把归一化到0-255之间,归一化数学函数选择的是
        # # NORM_MINMAX ,flatten()是将得到的数组转换为一维数组,不能之间用于list
        # nhist = cv2.normalize(nhist, nhist, 0, 255, cv2.NORM_MINMAX).flatten()
        # features.append(nhist)

        #第二种特征提取方法,转为灰度图,转为一维数组
        img1=cv2.cvtColor(img,cv2.COLOR_BGR2GRAY)
        img3=img1.flatten()
        features.append(img3)


    """
    变成一个数组
    """
    input_x = np.array(features)
    print('数据维数',input_x.shape)
    input_x=input_x[:,1:5]
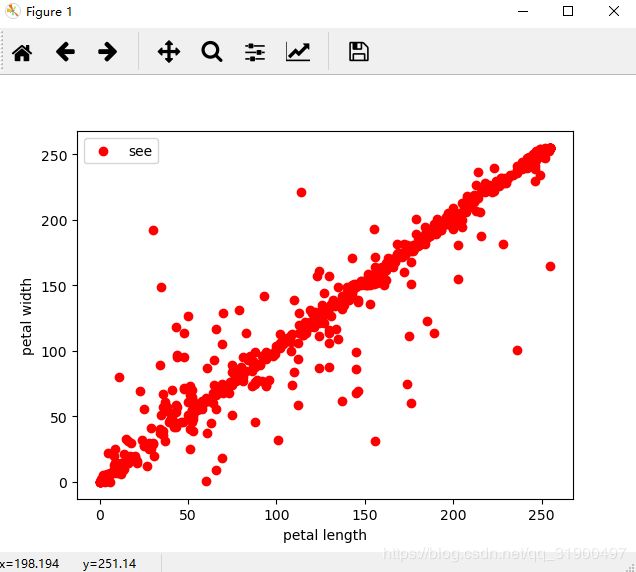
    plt.figure(1)
    plt.scatter(input_x[:, 0], input_x[:, 1], c = "red", marker='o', label='see')
    plt.xlabel('petal length')
    plt.ylabel('petal width')
    # 设置图例的位置
    plt.legend(loc=2)
    plt.show()

    """
    input required k ,build an object of KMeans; then cluster
    """
    kmeans = KMeans(n_clusters=cluster_nums,max_iter=50000000)
    kmeans.fit(input_x)
    label_pred=kmeans.labels_
    #绘制k-means结果
    x0 = input_x[label_pred == 0]
    x1 = input_x[label_pred == 1]
    x2 = input_x[label_pred == 2]
    x3 = input_x[label_pred == 3]
    x4 = input_x[label_pred == 4]
    x5 = input_x[label_pred == 5]
    plt.figure(2)
    plt.scatter(x0[:, 0], x0[:, 1], c = "red", marker='o', label='label0')
    plt.scatter(x1[:, 0], x1[:, 1], c = "green", marker='*', label='label1')
    plt.scatter(x2[:, 0], x2[:, 1], c = "blue", marker='+', label='label2')
    plt.scatter(x3[:, 0], x3[:, 1], c = "black", marker='p', label='label3')
    plt.scatter(x4[:, 0], x4[:, 1], c = "green", marker='d', label='label4')
    plt.scatter(x5[:, 0], x5[:, 1], c = "k", marker='<', label='label5')
    plt.xlabel('petal length')
    plt.ylabel('petal width')
    plt.legend(loc=2)
    plt.show()

    mark=['or','ob','og','ok','^r','+r','sr','dr','
效果图:
1、数据分布
2、聚类效果:

