十 Keras基础实例 电影评价预测
文章目录
- 数据预处理
- 文本的向量化
- 建立网络
数据预处理
import keras
from keras import layers
import matplotlib.pyplot as plt
%matplotlib inline
data = keras.datasets.imdb ##引入keras内置的imdb电影数据集
max_word = 10000##指定加载最大10000个单词 我们不可能加载所有的单词评价,控制网络规模
(x_train, y_train), (x_test, y_test) = data.load_data(num_words=max_word)
x_train.shape, y_train.shape
x_train[0]

是一大串数据,把每一个单词用序号代替,评论是一个正数组成的序列
y_train
![]()
y时由1和0组成的,1代表正面评价,0代表负面评价
看一下每一个序号对应的评论是什么,word与index的对应关系是什么
word_index = data.get_word_index() ##这里用了下载
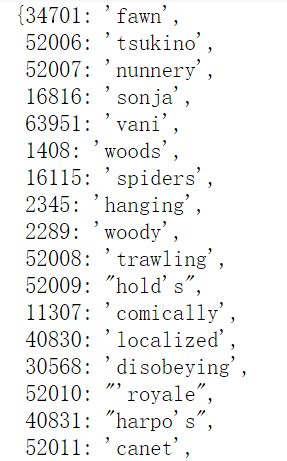
word_index
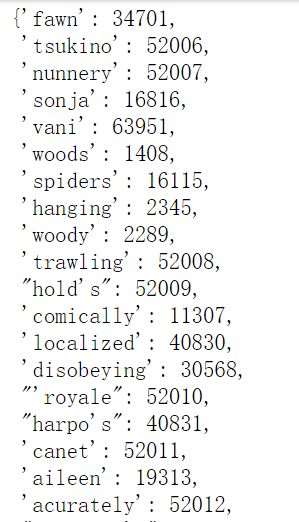
每个单词对应的序号,实际上我们只考虑了前10000个,实际上word和index是一个字典
我们把这个字典反转一下
index_word = dict((value, key) for key,value in word_index.items()) ##返回一个index_word
[index_word.get(index-3, '?') for index in x_train[0]]
获取第一条评论内容,前三个对应的并不是单词是一些错误什么的,给舍弃
首先获取word_index,再将其反转为index_word 对应的value和key
计算出每一条评论的单词长度
[len(seq) for seq in x_train]

每一个评价中的单词我们都对其做了一个索引,这个索引的最大长度不会超过9999,规定最多不超过10000个单词
max([max(seq) for seq in x_train])
max(seq) for seq in x_train] :选出每个评价中单词对应的索引最大值
max([max(seq) for seq in x_train]):选出所有评价最大值
文本的向量化
k-hot 编码
把每一条评论编码为长度为10000的向量,对于每一个评论,把里面对应的位置置为1,多个地方置为1
import numpy as np
def k_hot(seqs, dim=10000):  ##文本对应序列 转化向量维度
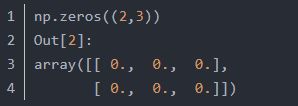
    result = np.zeros((len(seqs), dim))  ##文本长度 向量长度 为每一个电影评价建立一个10000的全零向量
    for i, seq in enumerate(seqs):## enumerate
        result[i, seq] = 1  ##i代表的是第i条评论,seq指的是这个序列中的内容,结合起来就将seq中对应位置置为1
    return result
enumerate对一个列表,既遍历索引又遍历元素。
将x_train用k_hot编码
x_train = k_hot(x_train)
x_train.shape
![]()
x_train变为了25000个10000维向量。之前单词编号对应的每一个位置变为1
看一下第一条训练评论内容
x_train[0]
x_train[0].shape
x_test = k_hot(x_test)
建立网络
model = keras.Sequential()
model.add(layers.Dense(32, input_dim=10000, activation='relu'))
model.add(layers.Dense(32, activation='relu'))
model.add(layers.Dense(1, activation='sigmoid'))
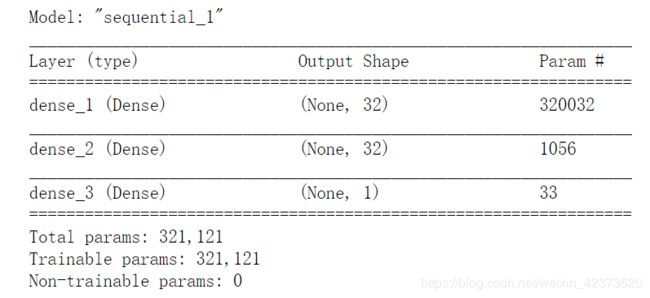
model.summary()
model.compile(optimizer='adam',
              loss='binary_crossentropy',
              metrics=['acc']
)
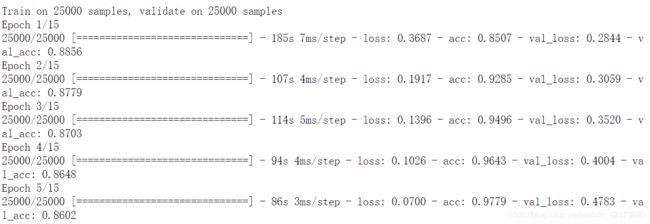
history = model.fit(x_train, y_train, epochs=15, batch_size=256, validation_data=(x_test, y_test))
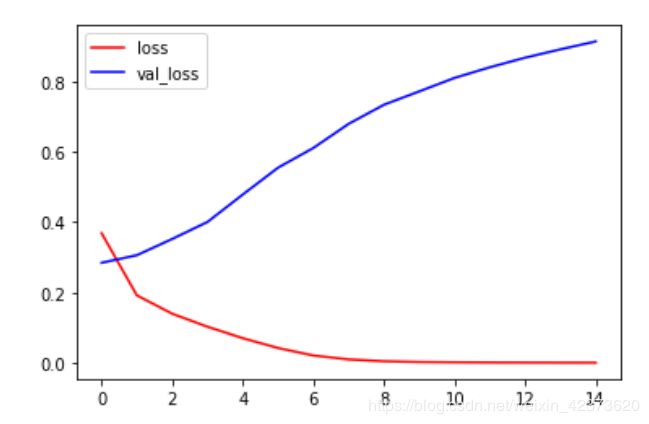
plt.plot(history.epoch, history.history.get('loss'), c='r', label='loss')
plt.plot(history.epoch, history.history.get('val_loss'), c='b', label='val_loss')
plt.legend()
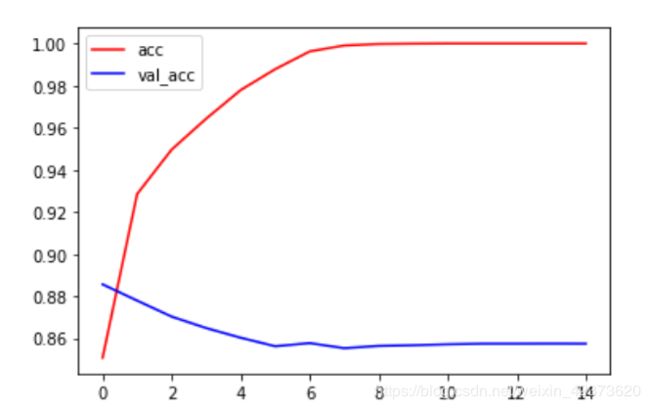
plt.plot(history.epoch, history.history.get('acc'), c='r', label='acc')
plt.plot(history.epoch, history.history.get('val_acc'), c='b', label='val_acc')
plt.legend()


