1、部署架构图

2、具体安装参考 “Centos 7 部署 Prometheus、Alertmanager、Grafana 监控 Linux 主机"
3、高可用配置
3.1 prometheus 高可用配置(除了systemd的配置不一样,2个节点的其他配置一样)
// 节点1:172.18.23.253
[root@ops001 ~]# cat /etc/systemd/system/prometheus.service
[Unit]
Description=Prometheus Server
Documentation=https://prometheus.io/docs/introduction/overview/
After=network-online.target

[Service]
Restart=on-failure
ExecStart=/usr/local/prometheus-2.4.3.linux-amd64/prometheus --config.file=/usr/local/prometheus-2.4.3.linux-amd64/prometheus.yml --storage.tsdb.path=/var/lib/prometheus --web.enable-lifecycle --web.external-url=http://172.18.23.253:9090

[Install]
WantedBy=multi-user.target

[root@ops001 ~]# cat /usr/local/prometheus-2.4.3.linux-amd64/prometheus.yml
# my global config
global:
  scrape_interval:     15s # Set the scrape interval to every 15 seconds. Default is every 1 minute.
  evaluation_interval: 15s # Evaluate rules every 15 seconds. The default is every 1 minute.
  # scrape_timeout is set to the global default (10s).

# Alertmanager configuration
alerting:
  alertmanagers:
  - static_configs:
    - targets:
      - '172.18.23.253:9093'
      - '172.18.23.252:9093'
      - '172.18.23.251:9093'

# Load rules once and periodically evaluate them according to the global 'evaluation_interval'.
rule_files:
  - "rules/host_rules.yml"    # 告警规则文件
  # - "second_rules.yml"

# A scrape configuration containing exactly one endpoint to scrape:
# Here it's Prometheus itself.
scrape_configs:
  # The job name is added as a label `job=` to any timeseries scraped from this config.
  - job_name: 'prometheus'

    # metrics_path defaults to '/metrics'
    # scheme defaults to 'http'.

    static_configs:
    - targets: ['localhost:9090']

  - file_sd_configs:
    - files:
      - 'configs/host.yml'
    job_name: Linux Host
    metrics_path: /metrics
    relabel_configs:
    - source_labels: [__address__]
      regex: (.*)
      target_label: instance
      replacement: $1
    - source_labels: [__address__]
      regex: (.*)
      target_label: __address__
      replacement: $1:9100
[root@ops001 ~]# cat /usr/local/prometheus-2.4.3.linux-amd64/rules/host_rules.yml
groups:
- name: 'Linux Instances'
  rules:
  - alert: InstanceDown
    expr: up == 0
    for: 5s
    labels:
      severity: page
    # Prometheus templates apply here in the annotation and label fields of the alert.
    annotations:
      description: '{{ $labels.instance }} of job {{ $labels.job }} has been down for more than 5 s.'
[root@ops001 ~]# cat /usr/local/prometheus-2.4.3.linux-amd64/configs/host.yml
- labels:
    service: test
  targets:
  - 172.18.23.253

// 节点2:172.18.23.252
[root@ops002 ~]# cat /etc/systemd/system/prometheus.service
[Unit]
Description=Prometheus Server
Documentation=https://prometheus.io/docs/introduction/overview/
After=network-online.target

[Service]
Restart=on-failure
ExecStart=/usr/local/prometheus-2.4.3.linux-amd64/prometheus --config.file=/usr/local/prometheus-2.4.3.linux-amd64/prometheus.yml --storage.tsdb.path=/var/lib/prometheus --web.enable-lifecycle --web.external-url=http://172.18.23.252:9090

[Install]
WantedBy=multi-user.target

[root@ops002 ~]# cat /usr/local/prometheus-2.4.3.linux-amd64/prometheus.yml
# my global config
global:
  scrape_interval:     15s # Set the scrape interval to every 15 seconds. Default is every 1 minute.
  evaluation_interval: 15s # Evaluate rules every 15 seconds. The default is every 1 minute.
  # scrape_timeout is set to the global default (10s).

# Alertmanager configuration
alerting:
  alertmanagers:
  - static_configs:
    - targets:
      - '172.18.23.253:9093'
      - '172.18.23.252:9093'
      - '172.18.23.251:9093'


rule_files:
  - "rules/host_rules.yml"    # 告警规则文件
  # - "second_rules.yml"

# A scrape configuration containing exactly one endpoint to scrape:
# Here it's Prometheus itself.
scrape_configs:
  # The job name is added as a label `job=` to any timeseries scraped from this config.
  - job_name: 'prometheus'

    # metrics_path defaults to '/metrics'
    # scheme defaults to 'http'.

    static_configs:
    - targets: ['localhost:9090']

  - file_sd_configs:
    - files:
      - 'configs/host.yml'
    job_name: Linux Host
    metrics_path: /metrics
    relabel_configs:
    - source_labels: [__address__]
      regex: (.*)
      target_label: instance
      replacement: $1
    - source_labels: [__address__]
      regex: (.*)
      target_label: __address__
      replacement: $1:9100
[root@ops002 ~]# cat /usr/local/prometheus-2.4.3.linux-amd64/rules/host_rules.yml
groups:
- name: 'Linux Instances'
  rules:
  - alert: InstanceDown
    expr: up == 0
    for: 5s
    labels:
      severity: page
    # Prometheus templates apply here in the annotation and label fields of the alert.
    annotations:
      description: '{{ $labels.instance }} of job {{ $labels.job }} has been down for more than 5 s.'
[root@ops002 ~]# cat /usr/local/prometheus-2.4.3.linux-amd64/configs/host.yml
- labels:
    service: test
  targets:
  - 172.18.23.253
3.2 alertmanager 高可用配置(除了systemd的配置不一样,3个节点的其他配置一样)
// 节点1:172.18.23.253
[root@ops001 ~]# cat /etc/systemd/system/alertmanager.service
[Unit]
Description=Alertmanager
After=network-online.target

[Service]
Restart=on-failure
ExecStart=/usr/local/alertmanager-0.15.2.linux-amd64/alertmanager --web.external-url=http://172.18.23.253:9093 --cluster.listen-address=172.18.23.253:9094 --cluster.peer=172.18.23.253:9094 --cluster.peer=172.18.23.252:9094 --cluster.peer=172.18.23.251:9094 --config.file=/usr/local/alertmanager-0.15.2.linux-amd64/alertmanager.yml

[Install]
WantedBy=multi-user.target

[root@ops001 ~]# cat /usr/local/alertmanager-0.15.2.linux-amd64/alertmanager.yml
global:
  resolve_timeout: 5m
  smtp_smarthost: 'smtp.sina.com:465'
  smtp_from: '[email protected]'
  smtp_auth_username: '[email protected]'
  smtp_auth_password: 'xxx'
  smtp_require_tls: false

templates:
 - '/usr/local/alertmanager-0.15.2.linux-amd64/template/*.tmpl'

route:
  group_by: ['alertname', 'cluster', 'service']
  group_wait: 30s
  group_interval: 5m
  repeat_interval: 10m
  receiver: 'default-receiver'

receivers:
- name: 'default-receiver'
  email_configs:
  - to: '[email protected]'
    send_resolved: true

  webhook_configs:
  - url: 'http://172.18.23.253 :8060/dingtalk/sre/send'
    send_resolved: true

// 节点2:172.18.23.252
[root@ops002 ~]# cat /etc/systemd/system/alertmanager.service
[Unit]
Description=Alertmanager
After=network-online.target

[Service]
Restart=on-failure
ExecStart=/usr/local/alertmanager-0.15.2.linux-amd64/alertmanager --web.external-url=http://172.18.23.252:9093 --cluster.listen-address=172.18.23.252:9094 --cluster.peer=172.18.23.253:9094 --cluster.peer=172.18.23.252:9094 --cluster.peer=172.18.23.251:9094 --config.file=/usr/local/alertmanager-0.15.2.linux-amd64/alertmanager.yml

[Install]
WantedBy=multi-user.target

[root@ops002 ~]# cat /usr/local/alertmanager-0.15.2.linux-amd64/alertmanager.yml
global:
  resolve_timeout: 5m
  smtp_smarthost: 'smtp.sina.com:465'
  smtp_from: '[email protected]'
  smtp_auth_username: '[email protected]'
  smtp_auth_password: 'xxx'
  smtp_require_tls: false

templates:
 - '/usr/local/alertmanager-0.15.2.linux-amd64/template/*.tmpl'

route:
  group_by: ['alertname', 'cluster', 'service']
  group_wait: 30s
  group_interval: 5m
  repeat_interval: 10m
  receiver: 'default-receiver'

receivers:
- name: 'default-receiver'
  email_configs:
  - to: '[email protected]'
    send_resolved: true

  webhook_configs:
  - url: 'http://172.18.23.253:8060/dingtalk/sre/send'
    send_resolved: true

// 节点3:172.18.23.251
[root@ops003 ~]# cat /etc/systemd/system/alertmanager.service
[Unit]
Description=Alertmanager
After=network-online.target

[Service]
Restart=on-failure
ExecStart=/usr/local/alertmanager-0.15.2.linux-amd64/alertmanager --web.external-url=http://172.18.23.251:9093 --cluster.listen-address=172.18.23.251:9094 --cluster.peer=172.18.23.253:9094 --cluster.peer=172.18.23.252:9094 --cluster.peer=172.18.23.251:9094 --config.file=/usr/local/alertmanager-0.15.2.linux-amd64/alertmanager.yml

[Install]
WantedBy=multi-user.target


[root@ops003 ~]# cat /usr/local/alertmanager-0.15.2.linux-amd64/alertmanager.yml
global:
  resolve_timeout: 5m
  smtp_smarthost: 'smtp.sina.com:465'
  smtp_from: '[email protected]'
  smtp_auth_username: '[email protected]'
  smtp_auth_password: 'xxx'
  smtp_require_tls: false

templates:
 - '/usr/local/alertmanager-0.15.2.linux-amd64/template/*.tmpl'

route:
  group_by: ['alertname', 'cluster', 'service']
  group_wait: 30s
  group_interval: 5m
  repeat_interval: 10m
  receiver: 'default-receiver'

receivers:
- name: 'default-receiver'
  email_configs:
  - to: '[email protected]'
    send_resolved: true

  webhook_configs:
  - url: 'http://172.18.23.253:8060/dingtalk/sre/send'
    send_resolved: true
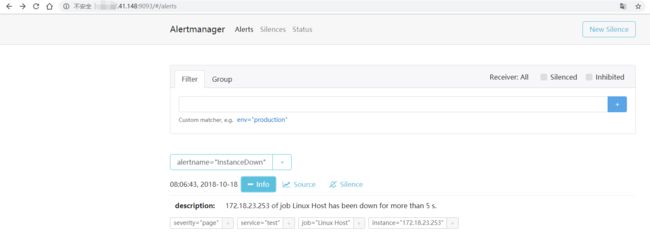
4、验证是否正常
模拟节点主机宕机
[root@ops001 ~]# systemctl stop node_exporter
// 节点1:172.18.23.253 prometheus

// 节点2:172.18.23.252 prometheus

// 节点1:172.18.23.253 alertmanager

// 节点2:172.18.23.252 alertmanager
// 节点3:172.18.23.251 alertmanager
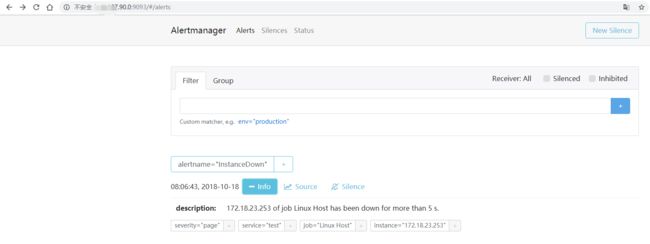
可以看到 2 个 prometheus 产生了相同告警,3 个 alertmanager 都收到了 prometheus 推过来的告警信息 ,但经过 alertmanager 集群的处理,只会发送一条告警信息

