HighCharts 的column显示null值和0值效果/Column点击事件
先定义渲染函数, 注意3D参数选项, 还有click event 部分.function redrawPassRateTd(pvSerie,pvStation,pvData,pvTd){
var lvChart=$("");
pvTd.append(lvChart);
lvChart.highcharts({
chart: {
type: 'column',
width:"240",
height:"180",
margin:35,
options3d: {
enabled: true,
alpha: 10,
beta: 10,
depth: 30,
viewDistance: 100, // 视图距离,它对于计算角度影响在柱图和散列图非常重要。此值不能用于3D的饼图
frame: { // Frame框架,3D图包含柱的面板,我们以X ,Y,Z的坐标系来理解,X轴与 Z轴所形成
// 的面为bottom,Y轴与Z轴所形成的面为side,X轴与Y轴所形成的面为back,bottom、
// side、back的属性一样,其中size为感官理解的厚度,color为面板颜色
bottom: {
size: 10,
color: 'green'
},
side: {
size: 1,
color: 'transparent'
},
back: {
size: 1,
color: 'transparent'
}
}
},
},
title: {
text:""
},
credits:{enabled:false},
exporting:{enabled:false},
xAxis: {
type: 'category',
labels: {
rotation: 270,
style: {
fontSize: '9px',
fontFamily: 'Verdana, sans-serif'
}
}
},
yAxis: {
min: 0,
max:100,
softMin: 0,
softMax: 100,
visible:true,
title: {
text: ""
}
},
legend: {
enabled: false
},
tooltip: {
headerFormat: '{point.key}',
pointFormat: '{series.name}: ' +
'{point.y:.1f} %
',
shared: true,
useHTML: true
},
plotOptions: {
series:{
cursor: 'pointer',
point: {
events: {
click: function() {
/*for (var i = 0; i < this.series.data.length; i++) {
this.series.data[i].update({ color: '#ECB631' }, true, false);
}
this.update({ color: '#f00' }, true, false);
console.log(this);*/
var dt=new Date();
showTop10(pvSerie, pvStation,this.name+"/"+(2000+dt.getYear()-100));
}
}
}
},
column: {
//borderWidth: 2,
depth: 20,
dataLabels : {
enabled : true,
y: -20,
crop: false,
overflow: 'none',
rotation: 270,
formatter: function() {
return /*this.series.name+"
"+*/this.y + '%';
},
style : {
'fontSize' : '13px',
'color':'white'
}
}
}
},
series: pvData
});
}调用 :
redrawPassRateTd(series,key,[{name:key==""?"FPY+":key,data:lvTdData}],lvTd);
函数参数的pvData数据结构:

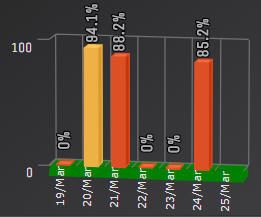
显示结果: