机器学习 第6章 支持向量机 概念总结和简单实践
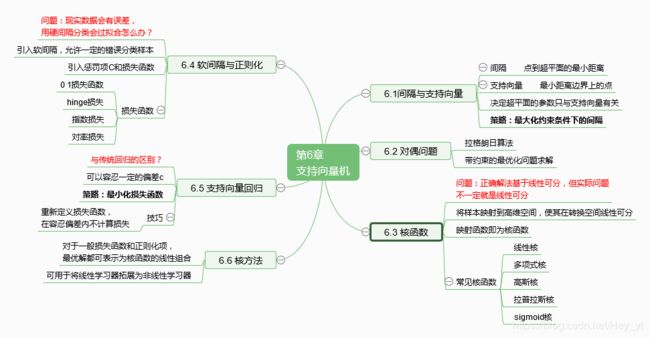
支持向量机解决的问题:在线性可分数据集上所有的划分超平面中寻找一个最优的超平面,它的解是唯一的。
寻找最优超平面的策略:最大化支持向量样本点与超平面的间隔,这样泛化能力最好。
核函数解决的问题:给非线性划分问题提供了线性解决的方法,即将实际的非线性数据集通过核函数映射到高维空间,使其在转换空间线性可分,然后再求解。
概念总结:
习题 6.2 使用LIBSVM 线性核和高斯核对西瓜数据集3.0进行训练,并比较支持向量。
# 表4-5
import pandas as pd
import numpy as np
data = np.loadtxt('./CH3-3watermeleondata.csv', delimiter=',')

X = data[:,0:2]
y = data[:,2]

# 线性核 --- LIBSVM已经可以在sklearn上直接使用,不用再按步骤安装了,即sklearn上的NuSVC模型
from sklearn.svm import NuSVC
nusvcclf = NuSVC(kernel='linear',random_state=0)
nusvcclf.fit(X,y)
# 看下预测结果
nusvcy_pred = nusvcclf.predict(X)
print(metrics.classification_report(y,nusvcy_pred))
linearVector = nusvcclf.support_vectors_  #支持向量
# 线性核的支持向量绘图
# X - some data in 2dimensional np.array
import matplotlib.pyplot as plt
steplength = 0.002  # 将训练出的模型用于高密度的预测,形成一条边界,就是二分类的边界线
x_min, x_max = X[:, 0].min() - 0.1, X[:, 0].max() + 0.1
y_min, y_max = X[:, 1].min() - 0.1, X[:, 1].max() + 0.1
xmesh = np.arange(x_min,x_max,steplength)
ymesh = np.arange(y_min, y_max,steplength)
xx, yy = np.meshgrid(xmesh,ymesh)

Z = nusvcclf.predict(np.c_[xx.ravel(), yy.ravel()])
#这里预测出来的Z是行向量,也需要重整理成矩阵形式
# Put the result into a color plot
Z = Z.reshape(xx.shape)
f1 = plt.figure()
plt.title('Linear Kernel boundary output')
plt.contourf(xx, yy, Z, cmap=plt.cm.Paired)
# Plot also the training points
plt.scatter(X[y == 0,0], X[y == 0,1], marker = 'v', color = 'k', s=100, label = 'bad')
plt.scatter(X[y == 1,0], X[y == 1,1], marker = 'o', color = 'g', s=100, label = 'good')
plt.scatter(linearVector[:,0],linearVector[:,1],marker = '.',color = 'r')
plt.show()

##### 高斯核
nusvc_rbf_clf = NuSVC(kernel='rbf',random_state=0)
nusvc_rbf_clf.fit(X,y)
nusvc_rbf_y_pred = nusvc_rbf_clf.predict(X)
print(metrics.classification_report(y,nusvc_rbf_y_pred))
rbfVector = nusvc_rbf_clf.support_vectors_
# 高斯核的支持向量绘图
# X - some data in 2dimensional np.array
import matplotlib.pyplot as plt
steplength = 0.002  # 将训练出的模型用于高密度坐标点的预测,形成一条预测值的一条边界,就是二分类的边界线
x_min, x_max = X[:, 0].min() - 0.1, X[:, 0].max() + 0.1
y_min, y_max = X[:, 1].min() - 0.1, X[:, 1].max() + 0.1
xmesh = np.arange(x_min,x_max,steplength)
ymesh = np.arange(y_min, y_max,steplength)
xx, yy = np.meshgrid(xmesh,ymesh)

Z = nusvc_rbf_clf.predict(np.c_[xx.ravel(), yy.ravel()]) #这里预测出来的Z是行向量,也需要重整理成矩阵形式
# Put the result into a color plot
Z = Z.reshape(xx.shape)
f2 = plt.figure()
plt.title('SBF kernel boundary output')
plt.contourf(xx, yy, Z, cmap=plt.cm.Paired)
# Plot also the training points
plt.scatter(X[y == 0,0], X[y == 0,1], marker = 'v', color = 'k', s=100, label = 'bad')
plt.scatter(X[y == 1,0], X[y == 1,1], marker = 'o', color = 'g', s=100, label = 'good')
plt.scatter(rbfVector[:,0],rbfVector[:,1],marker = '.',color = 'r') #红点表示支持向量
plt.show()
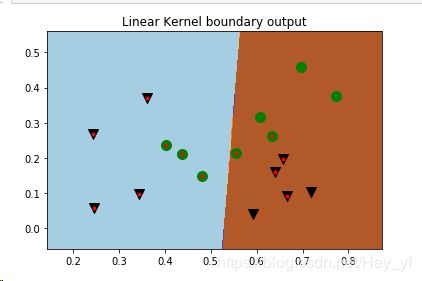
线性核和高斯核得出的边界划分如图,其中标记中有红点的为支持向量,绿色为数据集中好瓜,黑色下三角为数据集中坏瓜。
对比,高斯核的结果更好一点。高斯核中的支持向量更能直观感受支持向量是距离边界最近使约束条件等式成立的点,
但线性核中的支持向量边界右侧却有一些点未被划为支持向量,有点迷惑... 回头再来看。


