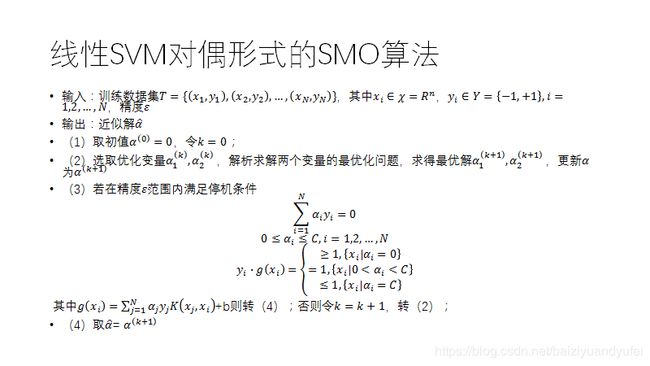
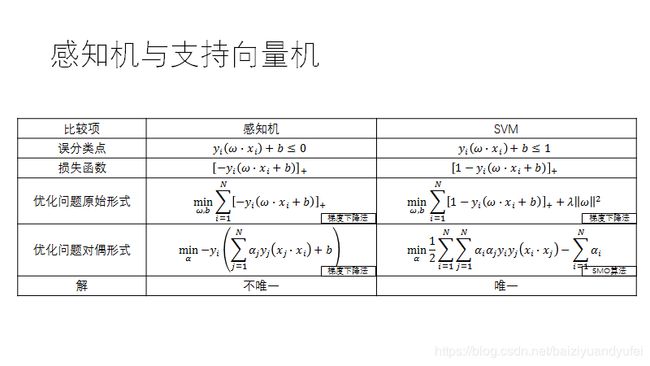
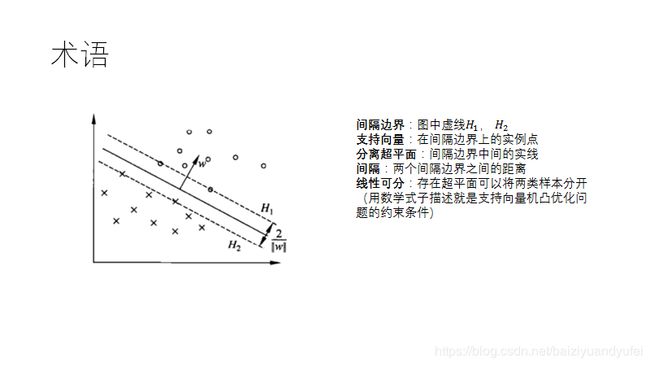
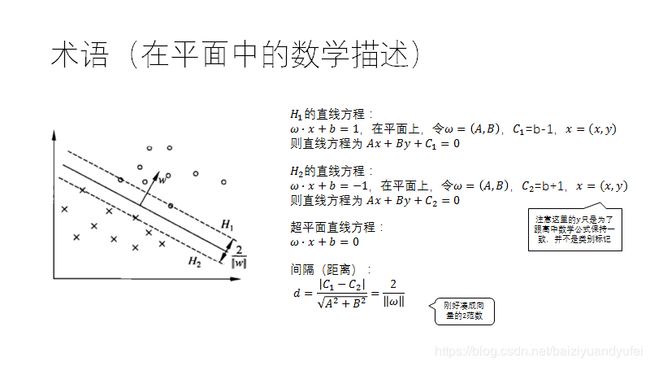
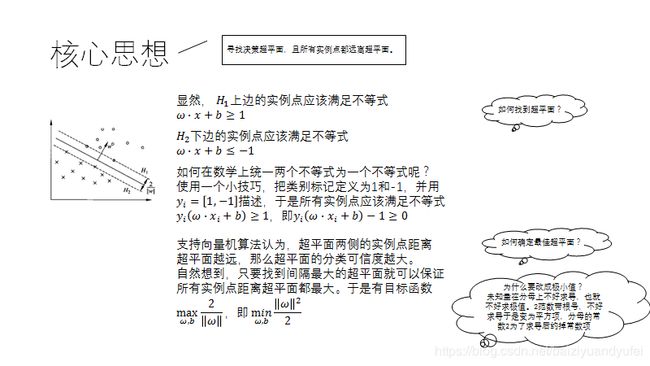
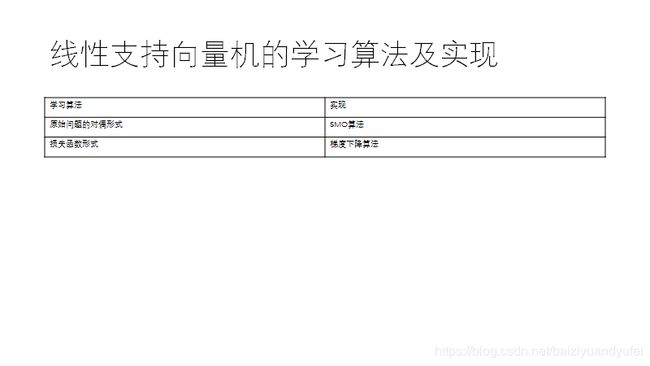
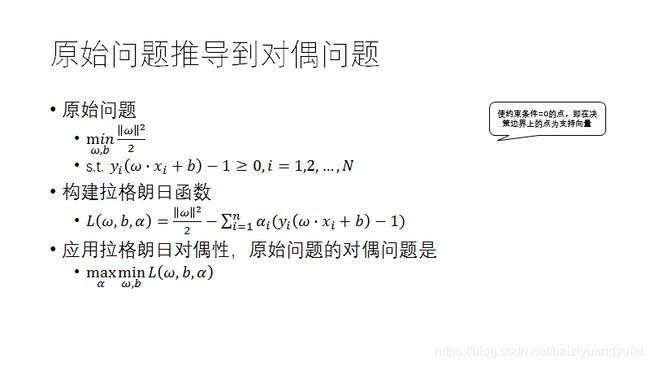
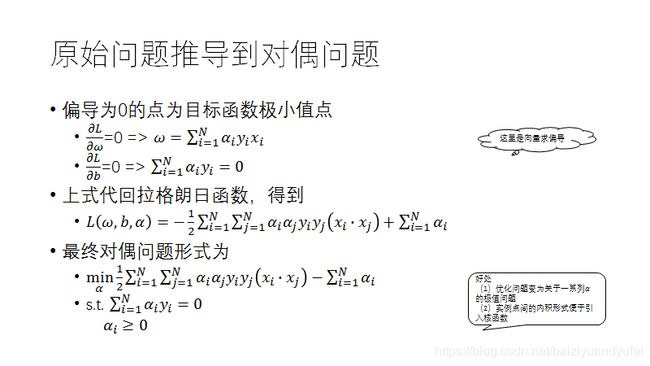
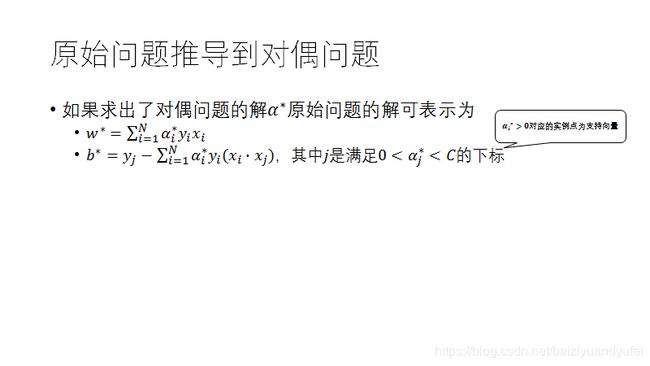
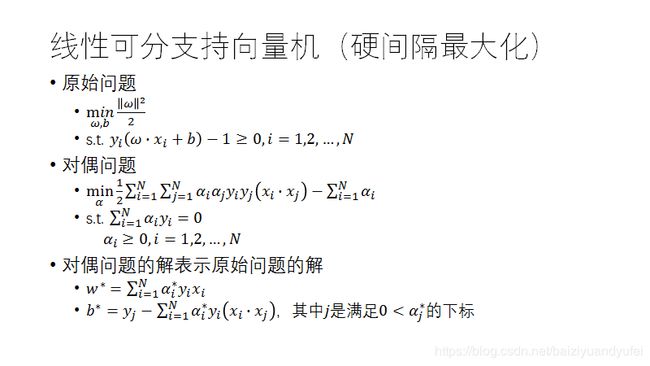
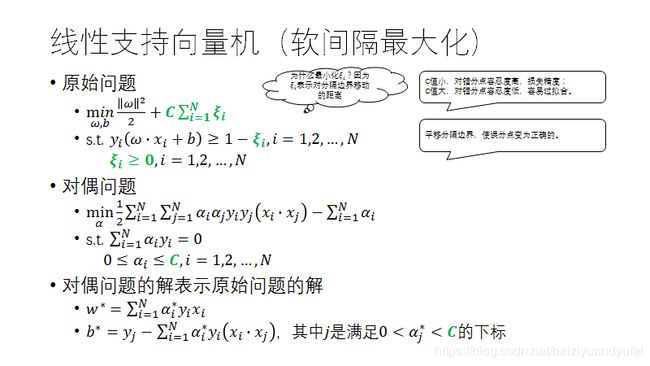
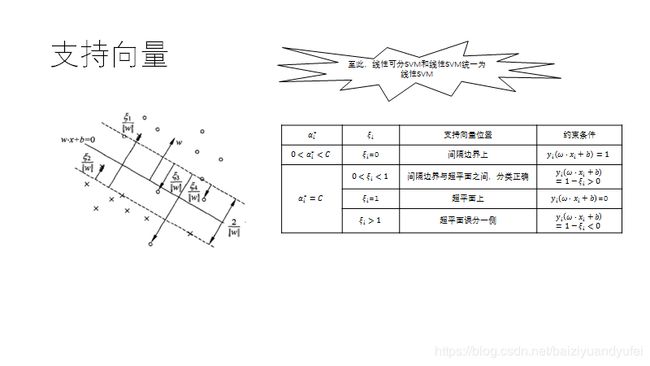
支持向量机是怎么画分类平面的?


#coding:utf-8
"""
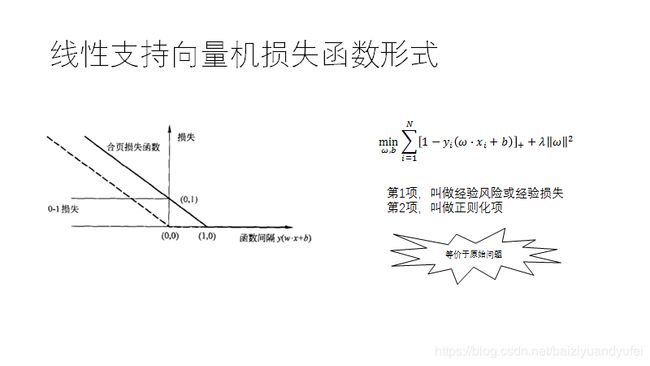
损失函数形式的支持向量机演示算法
"""

import numpy as np
from matplotlib import pyplot as plt
from matplotlib.colors import ListedColormap


# 线性支持向量机模型
class LinearSVM:
    # 构建分类模型
    def __init__(self, x, y, c=1, learning_rate=0.01, iterations=1000):
        """
        :param x: 训练实例
        :param y: 训练标记
        :param c: 惩罚因子
        :param learning_rate: 学习率
        :param iterations: 最大迭代次数
        """

        # 权值初始值
        self.w = np.array([0, 0])
        # 偏置初始值
        self.b = 0

        # 训练过程
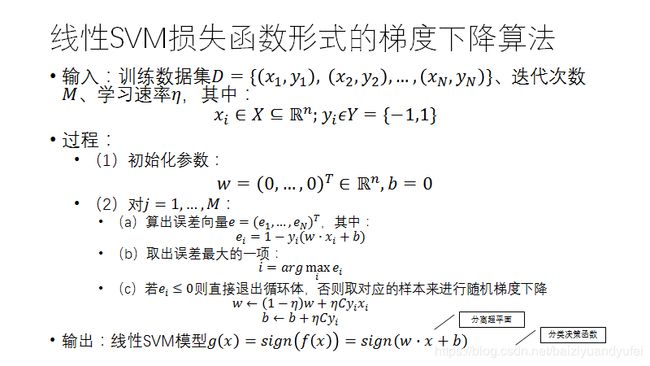
        for j in range(1, iterations+1):
            print("iter ", j)
            print("w=", self.w)
            print("b=", self.b)

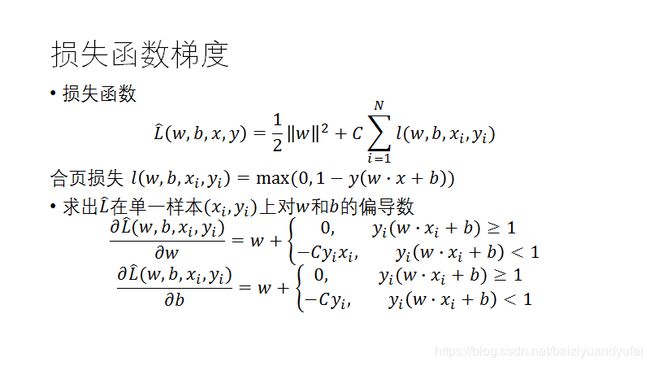
            # 计算误差向量
            ei_li = []
            for i in range(x.shape[0]):
                ei = 1 - y[i] * (np.dot(self.w, x[i, :]) + self.b)
                ei_li.append(ei)

            # 取出误差最大项
            max_e = max(ei_li)
            max_e_index = ei_li.index(max_e)

            # 最大误差项<=0 退出
            if max_e <= 0:
                break

            # 更新参数
            self.w = (1-learning_rate) * self.w + learning_rate * c * y[max_e_index] * x[max_e_index, :]
            self.b = self.b + learning_rate * c * y[max_e_index]

        # 训练结束
        print("w=", self.w)
        print("b=", self.b)

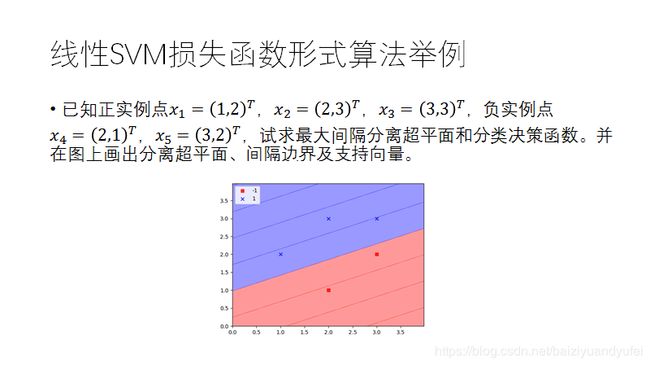
        # 画决策面
        colors = ('red', 'blue')
        cmap = ListedColormap(colors[:len(np.unique(y))])
        x1_min, x1_max = x[:, 0].min() - 1, x[:, 0].max() + 1
        x2_min, x2_max = x[:, 1].min() - 1, x[:, 1].max() + 1
        xx1, xx2 = np.meshgrid(np.arange(x1_min, x1_max, 0.02),
                               np.arange(x2_min, x2_max, 0.02))
        Z = self.predict(np.array([xx1.ravel(), xx2.ravel()]))
        Z = Z.reshape(xx1.shape)
        plt.contourf(xx1, xx2, Z, alpha=0.4, cmap=cmap)
        plt.xlim(xx1.min(), xx1.max())
        plt.ylim(xx2.min(), xx2.max())

        # 画样本点
        markers = ('s', 'x')
        for idx, ci in enumerate(np.unique(y)):
            plt.scatter(x=x[y == ci, 0], y=x[y == ci, 1], alpha=0.8, c=cmap(idx), marker=markers[idx], label=ci)

        # 画图例
        plt.legend(loc='upper left')
        plt.show()


    # 预测
    def predict(self, x):
        return np.dot(self.w, x) + self.b


if __name__ == "__main__":
    x = np.array([[1, 2],
                  [2, 3],
                  [3, 3],
                  [2, 1],
                  [3, 2]])
    y = np.array([1, 1, 1, -1, -1])
    svm = LinearSVM(x, y)
