power bi日期表相对_在Power BI中使用日期维度表
power bi日期表相对
In this article, I am going to describe how to use a date dimension table in Power BI. Using a date dimension table becomes extremely important while visualizing facts and figures over some time in the calendar. Sometimes it is possible that we do not have the continuous date values in our dataset that we are trying to work upon.
在本文中,我将描述如何在Power BI中使用日期维度表。 在可视化日历中一段时间内的事实和数字时,使用日期维度表变得尤为重要。 有时,我们的数据集中可能没有连续的日期值。
For example, let us consider sales from a supermarket which remains closed on the weekends. In such a case, there will be sales only for the weekdays and no sales happening on the weekends. If we try to work on the data for such a store, then in the data source, we will not have any data for the days on which the sales were not made. However, to do time-based calculations, it is necessary to have all the dates continuously in the database to properly aggregate the results.
例如,让我们考虑一家超市的销售,该超市在周末仍然关闭。 在这种情况下,仅在工作日有销售,而在周末没有销售。 如果我们尝试处理此类商店的数据,则在数据源中,我们将没有销售当天的任何数据。 但是,要进行基于时间的计算,必须将所有日期连续存储在数据库中以正确汇总结果。
So, to overcome this issue, we can introduce a concept of date dimension table in Power BI, in which we will pre-populate all the possible date values for a few years and then make a join with the date of the sales. When creating the visualizations, we can take the date values from the date dimension table and the sales values from the sales table. In this way, we will have a clear idea on which days there were sales made and which were the days with zero sales.
因此,为解决此问题,我们可以在Power BI中引入日期维度表的概念,在其中我们将预先填充几年中所有可能的日期值,然后将销售日期加入到表中。 创建可视化文件时,我们可以从日期维度表中获取日期值,从销售表中获取销售值。 通过这种方式,我们将清楚地知道哪些天进行了销售,哪些天进行了零销售。
创建日期维度 (Creating the Date Dimension)
There are two ways of creating the date dimension as follows:
有两种创建日期维度的方法,如下所示:
- Using a SQL table as the date dimension 使用SQL表作为日期维
- Using DAX to create a date dimension in Power BI 使用DAX在Power BI中创建日期维度
If the dataset that we are working on comes from a SQL database, then it is ideal that we can create a small date dimension table in that database itself. However, if the source is not an SQL database, but some SaaS products or some other file system, then we can use DAX to create a separate date dimension in the Power BI data model. In this article, let us explore how to create and use the date dimension in Power BI using DAX
如果我们正在处理的数据集来自SQL数据库,那么理想的情况是我们可以在该数据库本身中创建一个小的日期维度表。 但是,如果源不是SQL数据库,而是某些SaaS产品或其他文件系统,则可以使用DAX在Power BI数据模型中创建单独的日期维度。 在本文中,让我们探索如何使用DAX在Power BI中创建和使用日期维度
使用DAX创建日期维度 (Creating the Date Dimension using DAX)
Power BI is an amazing business intelligence tool that gives us the ability to calculate many time-intelligent calculations based on the available underlying data. Few in-built functions allow the business users to calculate month-over-month, or month-to-date, etc. calculations just out of the box. The only requirement for Power BI to calculate such functions is to have a date dimension table in the Power BI data model on which it can make the calculations.
Power BI是一个了不起的商业智能工具,它使我们能够基于可用的基础数据来计算许多时间智能的计算。 很少有内置功能允许业务用户直接使用开箱即用的方法来逐月或逐月进行计算。 Power BI计算此类功能的唯一要求是在Power BI数据模型中具有一个日期维度表,可以在该日期维度表上进行计算。
Let us now go ahead and enable the Auto Date/Time function under the Time Intelligence options.
现在让我们继续,在“ 时间智能”选项下启用“ 自动日期/时间”功能。
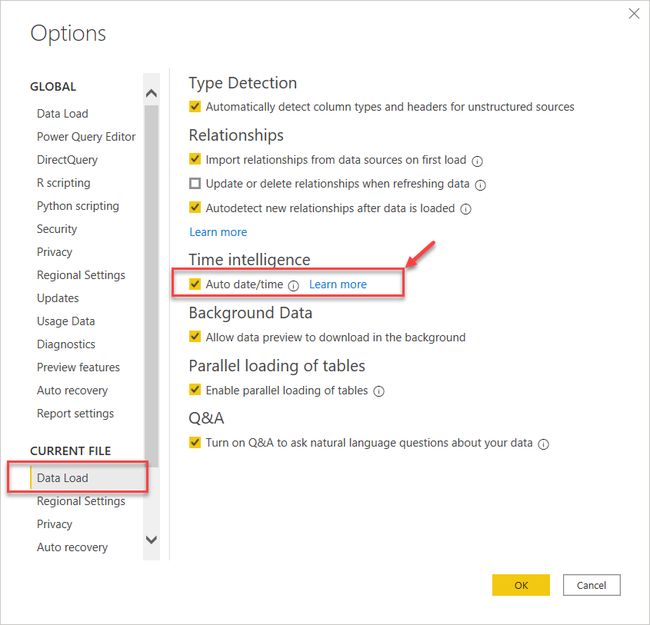
Open Power BI Desktop and click on File. Select Options and settings, and a new dialog box will appear. In the new dialog box, select Data Load and check the box against Auto date/time:
打开Power BI Desktop,然后单击“ 文件” 。 选择选项和设置 ,将出现一个新对话框。 在新对话框中,选择数据加载,然后选中自动日期/时间复选框:
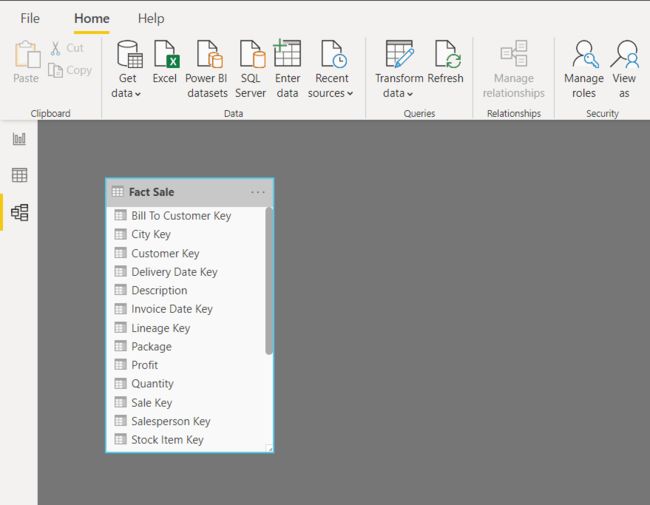
Next, let us fetch some sales data into the Power BI data model. For the sake of this article, I am going to use the Fact.Sale table from the WideWorldImportersDW database. In the Power BI Desktop, go to Get Data and select SQL Server. Select the Fact.Sale table and click on Load. This will connect to the SQL Server database table and bring the data into the Power BI environment:
接下来,让我们将一些销售数据提取到Power BI数据模型中。 为了本文的方便,我将使用WideWorldImportersDW数据库中的Fact.Sale表。 在Power BI桌面中,转到“ 获取数据”,然后选择“ SQL Server” 。 选择Fact.Sale表,然后单击Load 。 这将连接到SQL Server数据库表,并将数据带入Power BI环境:
Once the table is imported, you can see the Power BI data model as follows:
导入表格后,您可以看到Power BI数据模型,如下所示:
Let us now create the calendar table in the Power BI. To give it a name, let us call the table DateDimension:
现在让我们在Power BI中创建日历表。 为了给它起一个名字,让我们称这个表为DateDimension :
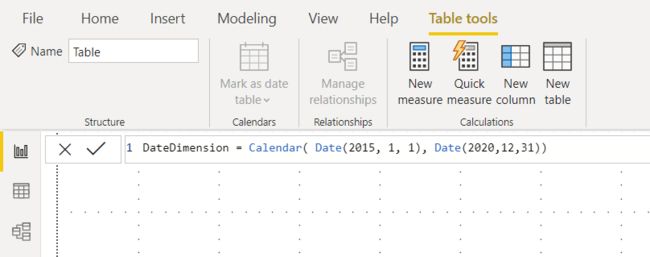
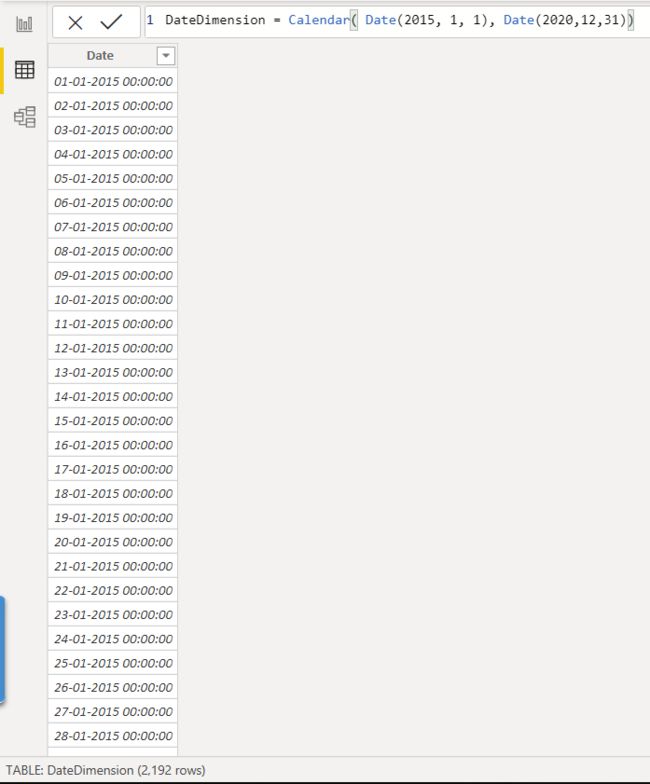
To create the date dimension in Power BI, click on the Data view, which is available on the left bar, and then navigate to the Modelling tab on the top. Select the New Table and enter the following DAX expression to generate a calendar table with records starting from 1st January 2015 to 31st December 2020. This will create a new table with all the dates all these six years:
要在Power BI中创建日期维度,请单击左侧栏上可用的数据视图 ,然后导航至顶部的“ 建模”选项卡。 选择新表,然后输入以下DAX表达式生成开始从1月1 日到2015年12月31 日到2020年这将创建一个新表的所有日期所有这六年中记录的日历表:
DateDimension = Calendar( Date(2015, 1, 1), Date(2020,12,31))
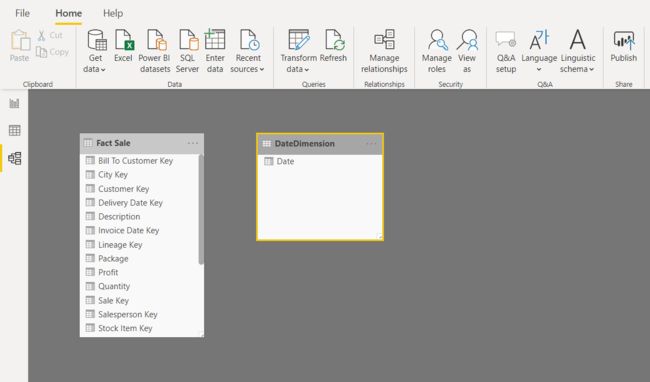
Click on the tick button or press Enter to generate the table. You can now see the new table has been added to the Power BI Data model with only one field in it:
单击对勾按钮或按Enter生成表。 现在,您可以看到新表已添加到Power BI Data模型中,其中只有一个字段:
Now that our basic date dimension table is ready, we can go ahead and add additional columns to it. These additional columns can be like Month, Week, Year, Weekday, etc. To keep things simple, let’s just add the month, quarter, and year to the table.
现在我们的基本日期维度表已准备就绪,我们可以继续向其添加其他列。 这些其他列可以像月,周,年,工作日等。为简单起见,我们只需将月,季度和年添加到表中即可。
Click on the New Column button and add the following DAX expression to create the month’s labels for all the dates in the table. This will create the Month column in the table:
单击“新列”按钮,然后添加以下DAX表达式以为表中的所有日期创建月份的标签。 这将在表中创建“月”列:
Month = Format('DateDimension'[Date], "MMM yyyy")
Similarly, add the columns for Quarter and Year accordingly. You are free to add as many columns as required into this table:
同样,相应地为季度和年份添加列。 您可以随意在此表中添加任意多的列:
Quarter = Year(DateDimension[Date]) & "-Q" & Format(DateDimension[Date], "q")
Year = Format(DateDimension[Date], "yyyy")
Once all the columns have been added to the data model, the date dimension will look something like this:
将所有列添加到数据模型后,日期维度将如下所示:
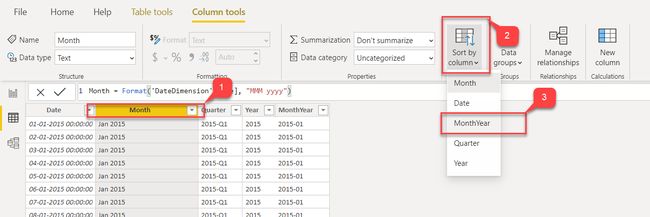
Since the Month column we added is a string field, the months will be sorted alphabetically and not chronologically. To sort the months chronologically, let us add a MonthYear column which will sort the Month based on the integer value of the months and years:
由于我们添加的月份列是一个字符串字段,因此月份将按字母顺序而不是按时间顺序排序。 为了按时间顺序对月份进行排序,让我们添加一个MonthYear列,该列将根据月份和年份的整数值对月份进行排序:
MonthYear = Format(DateDimension[Date], "yyyy-mm")
Select the Month column and sort it is using the MonthYear column:
选择Month列和排序它使用的是MonthYear列:
That date dimension is now ready. The final step here is to link this date dimension with the Sales table in Power BI:
该日期维度现已准备就绪。 这里的最后一步是将该日期维与Power BI中的Sales表链接:
To do that, we need to create a relationship between these two tables.
为此,我们需要在这两个表之间创建一个关系。
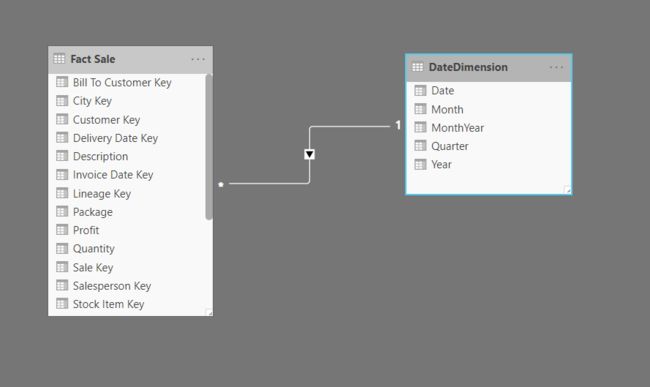
In the Data Model view, drag and drop the Date column from the DateDimension onto the InvoiceDateKey field in the FactSale table:
在“数据模型”视图中,将“ 日期”列从DateDimension拖放到FactSale表的InvoiceDateKey字段中:
As you can see in the figure above, select the InvoiceDateKey column from the FactSale table and then select the Date column from the DateDimension table. This will establish a relation between the two tables. In the Cardinality settings, select Many-to-one as the relationship type and Cross Filter Direction as Single. Click OK once done:
正如你在上图中看到,请从FactSale表InvoiceDateKey列,然后选择从DateDimension表的日期列。 这将在两个表之间建立关系。 在“ 基数”设置中,选择“ 多对一”作为关系类型,选择“ 交叉过滤器方向”作为“ 单一” 。 完成后单击“ 确定” :
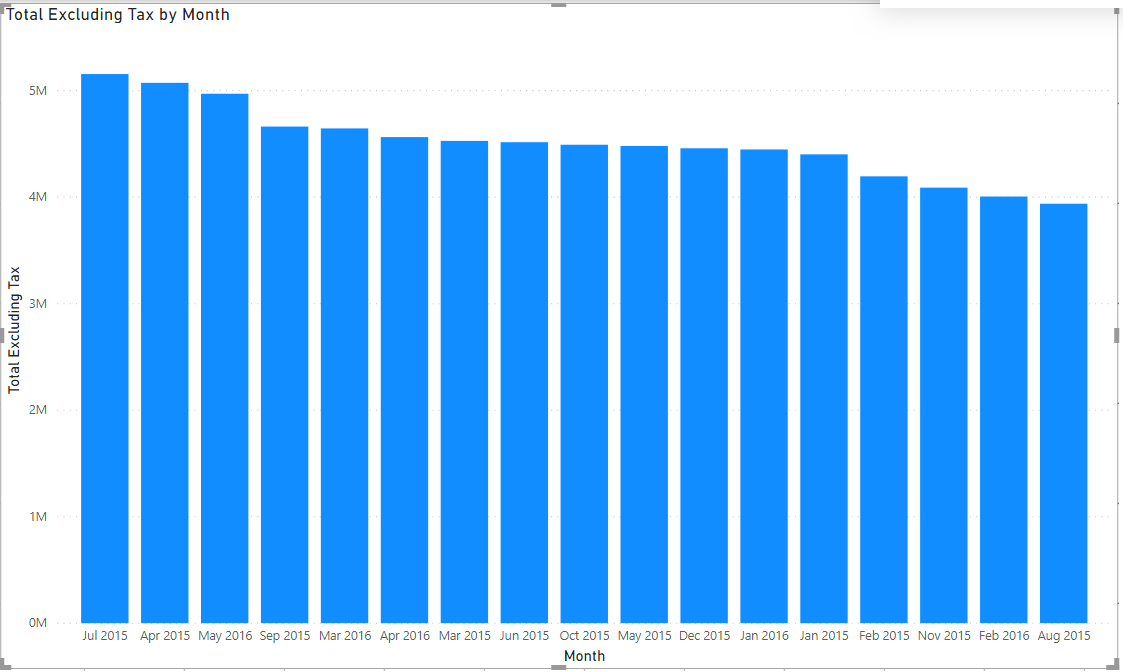
Now that the Date dimension is created let’s go ahead and quickly create a visualization out of it. Click on the Report Pane and select the Stacked Column chart from the menu. Click on the Month column from the DateDimension table and add it to the axis. Next, click on the Total Excluding Tax column and add it to the values pane:
现在已经创建了Date维度,让我们继续快速地从中创建可视化。 单击报表窗格,然后从菜单中选择堆积柱形图 。 单击DateDimension表中的Month列,并将其添加到轴 。 接下来,单击“ 总的不含税”列并将其添加到值窗格中:
As you can see in the above figure, we have created the report by fetching the months from the date dimension table and the values from the FactSale table.
如上图所示,我们通过从日期维度表中获取月份和从FactSale表中获取值来创建了报告。
结论 (Conclusion)
In this article, we have seen how to implement a date dimension table in Power BI and how to visualize the missing periods therein. Using a date dimension table is important, especially while making time-based calculations. It is also useful to understand which were the periods with good sales and periods where there were no sales at all. In short, using a date dimension tables adds an advantage to correctly display graphs without missing out any periods which are not available in the dataset.
在本文中,我们已经看到了如何在Power BI中实现日期维度表以及如何可视化其中的缺失时间段。 使用日期维度表非常重要,尤其是在进行基于时间的计算时。 了解哪些是销售良好的期间以及根本没有销售的期间也很有用。 简而言之,使用日期维度表可增加正确显示图形的优势,而不会遗漏数据集中不存在的任何时间段。
翻译自: https://www.sqlshack.com/using-a-date-dimension-table-in-power-bi/
power bi日期表相对
