机器学习技法笔记总结(一)SVM系列总结及实战
机器学习技法笔记总结(一)SVM系列总结及实战
1、原理总结
在机器学习课程的第1-6课,主要学习了SVM支持向量机。
SVM是一种二类分类模型。它的基本模型是在特征空间中寻找间隔最大化的分离超平面的线性分类器。
(1)当训练样本线性可分时,通过硬间隔最大化,学习一个线性分类器,即线性可分支持向量机;
这也就是机器学习技法笔记1中学习的内容。机器学习技法笔记1:线性SVM,在这篇笔记的第1.1节中,首先从直观上说明了最大间隔超平面的好处,也就是容忍噪声性比较好,不易发生过拟合。接着在第1.2节中,将第一节中的描述通过公式进行了描述,得到了SVM的原始形式。在第1.3节中,采用二次规划的方法说明可以对SVM进行求解。在第1.4节中,说明的SVM的理论依据,也就是通过控制间隔在一定程度上起到了正则化的作用,使得VC维不那么大,如果在线性SVM的基础上引入非线性变换,就可以兼顾VC维和模型复杂度。
有了SVM的基本形式,为了防止计算量过大,就可以引入SVM的对偶形式,在机器学习技法笔记2中,推导了线性SVM对应的对偶形式。机器学习技法笔记2:SVM的对偶形式,接着在机器学习笔记3:Kernel SVM中,通过将kernel引入到SVM的对偶形式中,彻底解决了计算量过大的问题,并比较了不同kernel的优缺点。
(2)当训练数据线性不可分时,引入松弛变量,通过软间隔最大化,学习一个分类器,即soft-margin支持向量机;
在机器学习技法笔记4中,机器学习技法笔记4:soft-margin SVM中,详细介绍了这部分内容。
后面的两部分内容机器学习技法笔记5:kernel 逻辑回归和机器学习技法笔记6:SVR 中,是对SVM思想的一些扩充。在kernel 逻辑回归部分,首先第5-1节对比了soft-margin SVM和L2正则化的loss function,发现两者形式相同,那么large-margin也就对应于正则化,起到了防止过拟合的作用。第5-2节中对比了SVM和logistics regression的loss function,发现两者相似,第5-3节中,将SVM的结果应用在Soft Binary Classification中,得到是正类的概率值,也就是将SVM得到的结果看成非线性变换得到的分数,代入logistics regression的式子中,第5-4节中讲了另一种将SVM的思想应用于Soft Binary Classification的方法,也就是直接将W的线性组合形式代入到L2-regularized logistics regression的式子中,称为KLR(kernel logistics regression),第6-1节延续了第5-4节内容,将W的线性组合形式代入到L2-regularized ridge regression的式子中,得到KRR(kernel ridge regression),我们把KRR应用分类上上取个 新的名字,叫做least-squares SVM(LSSVM),由于在SVM中,根据KKT条件,我们得到的w最后是support vector的线性组合,这个大大减少了w的计算成本。而在LSSVM中,计算量很大,因为基本上每一个点都相当于SVM中的支撑向量,为了解决这个问题,可以引入中立区,也就是将KRR中的square error换成能够容忍错误点的error,这就是L2-regularized tude regression, 做一些系数上的变换就得到了SVR(支持向量回归)以及支持向量回归的对偶形式,这就是第6-2节和第6-3节的内容。
2、sklearn.svm实战
- 最简单的线性SVM
里面的绘图函数直接用即可,在这里随机生成了50个样本点,样本点的分布为两个簇,采用线性SVM对其进行分类
import numpy as np
import matplotlib.pyplot as plt
from scipy import stats
# 数据点的生成器
from sklearn.datasets.samples_generator import make_blobs
from sklearn.svm import SVC # "Support vector classifier"

# 绘图函数,直接用即可
def plot_svc_decision_function(model, ax=None, plot_support=True):
    """Plot the decision function for a 2D SVC"""
    if ax is None:
        ax = plt.gca()
    xlim = ax.get_xlim()
    ylim = ax.get_ylim()

    # create grid to evaluate model
    x = np.linspace(xlim[0], xlim[1], 30)
    y = np.linspace(ylim[0], ylim[1], 30)
    Y, X = np.meshgrid(y, x)
    xy = np.vstack([X.ravel(), Y.ravel()]).T
    P = model.decision_function(xy).reshape(X.shape)

    # plot decision boundary and margins
    ax.contour(X, Y, P, colors='k',
               levels=[-1, 0, 1], alpha=0.5,
               linestyles=['--', '-', '--'])
    ax.set_xlim(xlim)
    ax.set_ylim(ylim)

if __name__ == '__main__':
    #随机生成50个点,有两簇,cluster_std表示簇的离散程度
    X, y = make_blobs(n_samples=50, centers=2,
                  random_state=0, cluster_std=0.60)

    model = SVC(kernel='linear')
    model.fit(X, y)
    plt.scatter(X[:, 0], X[:, 1], c=y, s=50, cmap='autumn')
    plot_svc_decision_function(model)
    plt.show()
结果:

2. 当数据是非线性的时候,线性SVM无法分割,应该采用RBF
其中,参数C特别大的时候,分类要求很严格,不能有分类错误,C比较小的时候,可以容忍一些错误
import numpy as np
import matplotlib.pyplot as plt
from scipy import stats
# 数据点的生成器
from sklearn.datasets.samples_generator import make_blobs
from sklearn.svm import SVC # "Support vector classifier"
from sklearn.datasets.samples_generator import make_circles
# 绘图函数,直接用即可
def plot_svc_decision_function(model, ax=None, plot_support=True):
    """Plot the decision function for a 2D SVC"""
    if ax is None:
        ax = plt.gca()
    xlim = ax.get_xlim()
    ylim = ax.get_ylim()

    # create grid to evaluate model
    x = np.linspace(xlim[0], xlim[1], 30)
    y = np.linspace(ylim[0], ylim[1], 30)
    Y, X = np.meshgrid(y, x)
    xy = np.vstack([X.ravel(), Y.ravel()]).T
    P = model.decision_function(xy).reshape(X.shape)

    # plot decision boundary and margins
    ax.contour(X, Y, P, colors='k',
               levels=[-1, 0, 1], alpha=0.5,
               linestyles=['--', '-', '--'])
    ax.set_xlim(xlim)
    ax.set_ylim(ylim)

if __name__ == '__main__':
    #随机生成100个点
    X, y = make_circles(100, factor=.1, noise=.1)
    model = SVC(kernel='rbf', C=1E6)
    model.fit(X, y)
    plt.scatter(X[:, 0], X[:, 1], c=y, s=50, cmap='autumn')
    plot_svc_decision_function(model)
    plt.show()
- soft-margin的SVM
通过选择不同的参数C可以控制分类错误的大小。参数C无穷大的时候,分类要求很严格,不能有分类错误,C比较小的时候,可以容忍一些错误。在机器学习技法笔记4中,机器学习技法笔记4:soft-margin SVM中,详细介绍了这部分内容。
(1)C=0.1时
import numpy as np
import matplotlib.pyplot as plt
from scipy import stats
# 数据点的生成器
from sklearn.datasets.samples_generator import make_blobs
from sklearn.svm import SVC # "Support vector classifier"
from sklearn.datasets.samples_generator import make_circles
# 绘图函数,直接用即可
def plot_svc_decision_function(model, ax=None, plot_support=True):
    """Plot the decision function for a 2D SVC"""
    if ax is None:
        ax = plt.gca()
    xlim = ax.get_xlim()
    ylim = ax.get_ylim()

    # create grid to evaluate model
    x = np.linspace(xlim[0], xlim[1], 30)
    y = np.linspace(ylim[0], ylim[1], 30)
    Y, X = np.meshgrid(y, x)
    xy = np.vstack([X.ravel(), Y.ravel()]).T
    P = model.decision_function(xy).reshape(X.shape)

    # plot decision boundary and margins
    ax.contour(X, Y, P, colors='k',
               levels=[-1, 0, 1], alpha=0.5,
               linestyles=['--', '-', '--'])
    ax.set_xlim(xlim)
    ax.set_ylim(ylim)

if __name__ == '__main__':
    #随机生成100个点
    X, y = make_blobs(n_samples=100, centers=2,
                      random_state=0, cluster_std=0.9)
    model = SVC(kernel='linear', C=0.1)
    model.fit(X, y)
    plt.scatter(X[:, 0], X[:, 1], c=y, s=50, cmap='autumn')
    plot_svc_decision_function(model)
    plt.show()
结果:

存在错误点,且margin比较大
(2)C=10时,也就是将上面代码中C变为10

错误点变少,margin比较小
- RBF中的gamma参数
import numpy as np
import matplotlib.pyplot as plt
from scipy import stats
# 数据点的生成器
from sklearn.datasets.samples_generator import make_blobs
from sklearn.svm import SVC # "Support vector classifier"
from sklearn.datasets.samples_generator import make_circles
# 绘图函数,直接用即可
def plot_svc_decision_function(model, ax=None, plot_support=True):
    """Plot the decision function for a 2D SVC"""
    if ax is None:
        ax = plt.gca()
    xlim = ax.get_xlim()
    ylim = ax.get_ylim()

    # create grid to evaluate model
    x = np.linspace(xlim[0], xlim[1], 30)
    y = np.linspace(ylim[0], ylim[1], 30)
    Y, X = np.meshgrid(y, x)
    xy = np.vstack([X.ravel(), Y.ravel()]).T
    P = model.decision_function(xy).reshape(X.shape)

    # plot decision boundary and margins
    ax.contour(X, Y, P, colors='k',
               levels=[-1, 0, 1], alpha=0.5,
               linestyles=['--', '-', '--'])
    ax.set_xlim(xlim)
    ax.set_ylim(ylim)

if __name__ == '__main__':
    #随机生成100个点
    X, y = make_blobs(n_samples=100, centers=2,
                      random_state=0, cluster_std=0.9)
    fig, ax = plt.subplots(1, 2, figsize=(16, 6))
    for axi, gamma in zip(ax, [10.0, 0.1]):
        model = SVC(kernel='rbf', gamma=gamma)
        model.fit(X, y)
        axi.scatter(X[:, 0], X[:, 1], c=y, s=50, cmap='autumn')
        plot_svc_decision_function(model,axi)
    plt.show()
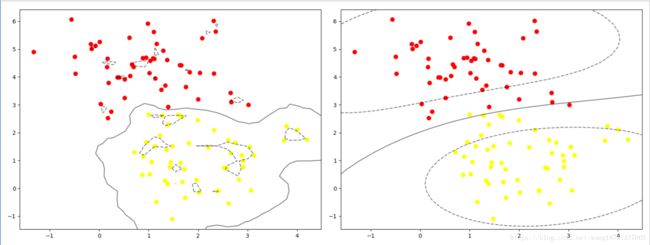
结果:

左图的gamma=10,右图gamma=0.1,可见gamma过大易出现过拟合现象。
这在机器学习技法3:kernel SVM中学习过
- 人脸识别例子
import numpy as np
import matplotlib.pyplot as plt
from sklearn.datasets import fetch_lfw_people
from sklearn.svm import SVC
from sklearn.decomposition import PCA
from sklearn.pipeline import make_pipeline
from sklearn.model_selection import train_test_split
from sklearn.model_selection import GridSearchCV
from sklearn.metrics import classification_report
import seaborn as sns
from sklearn.metrics import confusion_matrix
# 绘图函数,直接用即可
def plot_svc_decision_function(model, ax=None, plot_support=True):
    """Plot the decision function for a 2D SVC"""
    if ax is None:
        ax = plt.gca()
    xlim = ax.get_xlim()
    ylim = ax.get_ylim()

    # create grid to evaluate model
    x = np.linspace(xlim[0], xlim[1], 30)
    y = np.linspace(ylim[0], ylim[1], 30)
    Y, X = np.meshgrid(y, x)
    xy = np.vstack([X.ravel(), Y.ravel()]).T
    P = model.decision_function(xy).reshape(X.shape)

    # plot decision boundary and margins
    ax.contour(X, Y, P, colors='k',
               levels=[-1, 0, 1], alpha=0.5,
               linestyles=['--', '-', '--'])
    ax.set_xlim(xlim)
    ax.set_ylim(ylim)

if __name__ == '__main__':

    faces = fetch_lfw_people(min_faces_per_person=60)
    # 由于特征维数过大,可以先采用PCA进行降维,将其降到150维
    pca = PCA(n_components=150, whiten=True, random_state=42)
    # 对两个类别按照样本数目设置惩罚项
    svc = SVC(kernel='rbf', class_weight='balanced')
    model = make_pipeline(pca, svc)
    # 划分训练集和测试集
    Xtrain, Xtest, ytrain, ytest = train_test_split(faces.data, faces.target,
                                                    random_state=40)
    # 使用GridSearchCV选择参数
    param_grid = {'svc__C': [1, 5, 10],
                  'svc__gamma': [0.0001, 0.0005, 0.001]}
    grid = GridSearchCV(model, param_grid)

    grid.fit(Xtrain, ytrain)
    print("最优参数为:",grid.best_params_)
    model = grid.best_estimator_
    yfit = model.predict(Xtest)

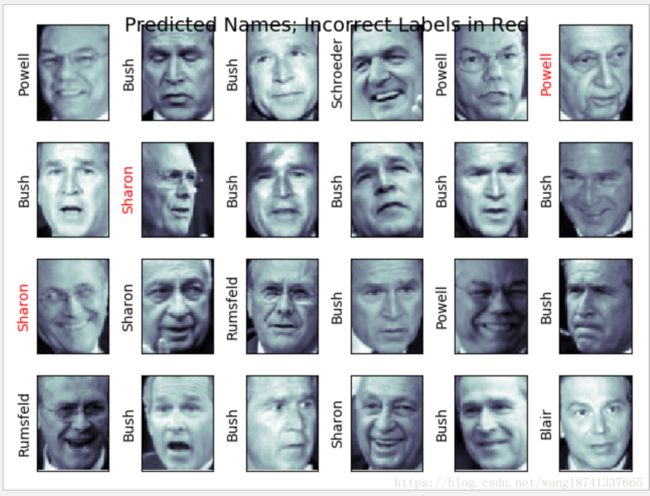
    # 显示出一部分预测结果,红色部分为预测错误的
    fig, ax = plt.subplots(4, 6)
    for i, axi in enumerate(ax.flat):
        axi.imshow(Xtest[i].reshape(62, 47), cmap='bone')
        axi.set(xticks=[], yticks=[])
        axi.set_ylabel(faces.target_names[yfit[i]].split()[-1],
                       color='black' if yfit[i] == ytest[i] else 'red')

    fig.suptitle('Predicted Names; Incorrect Labels in Red', size=14)

    # 给出预测值的相关结果
    print(classification_report(ytest, yfit,
                                target_names=faces.target_names))
    plt.show()
    # 给出混淆矩阵,并作出热度图,对角线上元素表示了预测正确的概率
    mat = confusion_matrix(ytest, yfit)
    sns.heatmap(mat.T, square=True, annot=True, fmt='d', cbar=False,
                xticklabels=faces.target_names,
                yticklabels=faces.target_names)
    plt.xlabel('true label')
    plt.ylabel('predicted label')
    plt.show()
结果:
最优参数为: {'svc__C': 5, 'svc__gamma': 0.0005}
                   precision    recall  f1-score   support
     Ariel Sharon       0.71      0.75      0.73        20
     Colin Powell       0.76      0.77      0.76        44
  Donald Rumsfeld       0.76      0.73      0.75        30
    George W Bush       0.92      0.92      0.92       148
Gerhard Schroeder       0.76      0.79      0.78        24
Junichiro Koizumi       1.00      0.82      0.90        11
       Tony Blair       0.88      0.88      0.88        24
      avg / total       0.85      0.85      0.85       301


