《Python编程:从入门到实践》最高温度, 最低温度可视化
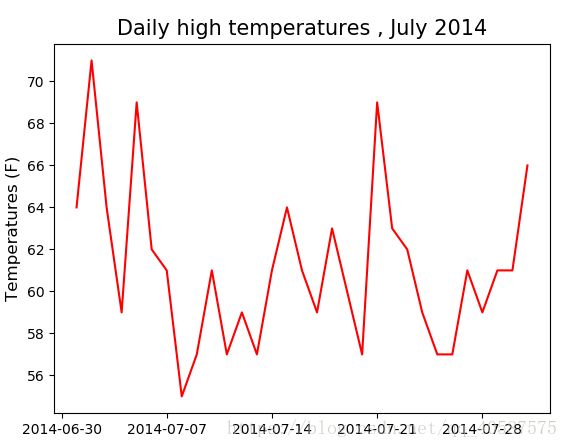
1,模块名称为 csv_demo.py,,数据集是阿拉斯加2014年7月的温度数据,简单的 阿拉斯加最高温度的可视化
#coding=gbk
#《pyhotn 编程:从入门到实践》 第16章:下载数据
import csv
filename = r'D:\datasets\sitka_weather_07-2014.csv'
with open(filename) as f:
    reader = csv.reader(f)
    header_row = next(reader)     # next 返回文件的第一行, 包括文件头,即表名
    #print(header_row)
#     for index , column_header in enumerate(header_row):    #使用 enumerate 迭代器输出 特征值
#         print(index, column_header)
# 0 AKDT        阿拉斯加时间
# 1 Max TemperatureF    每天的最高温度
# 2 Mean TemperatureF
# 3 Min TemperatureF
# 4 Max Dew PointF
#.........
# 22  WindDirDegrees
#读取文件中的最高气温数据集
    highs = []  #创建一个列表
    for row in reader:
        high = int(row[1])  #将列表中的字符串 转换成数值型
        highs.append(high)            #获得第二行的 的数据, 即每天的最高温度
    print(highs)    #[64, 71, 64, 59, 69, 62, 61, 55, 57, 61, 57, 59, 57, 61, 64, 61, 59,。。。。

#进行数据可视化
import matplotlib.pyplot as plt
plt.plot(highs, c='red')
#设置图形格式
plt.title('Daily high temperatures , July 2014', fontsize = 18)
plt.xlabel('',fontsize = 12)
plt.ylabel('Temperatures (F)',fontsize =12)
plt.tick_params(axis='both', which= 'major', labelsize = 10)
plt.show()
2,名称为scv_demo2.py模块,将横轴改时间显示
#coding=gbk
#《pyhotn 编程:从入门到实践》 第16章:下载数据
import csv
filename = r'D:\datasets\sitka_weather_07-2014.csv'
with open(filename) as f:
    reader = csv.reader(f)
    header_row = next(reader)     # next 返回文件的第一行, 包括文件头,即表名
    #print(header_row)
#     for index , column_header in enumerate(header_row):    #使用 enumerate 迭代器输出 特征值
#         print(index, column_header)
# 0 AKDT        阿拉斯加时间
# 1 Max TemperatureF    每天的最高温度
# 2 Mean TemperatureF
# 3 Min TemperatureF
# 4 Max Dew PointF
#.........
# 22  WindDirDegrees
#读取文件中的最高气温数据集
    highs = []  #创建一个列表
    for row in reader:
        high = int(row[1])  #将列表中的字符串 转换成数值型
        highs.append(high)            #获得第二行的 的数据, 即每天的最高温度
    print(highs)    #[64, 71, 64, 59, 69, 62, 61, 55, 57, 61, 57, 59, 57, 61, 64, 61, 59,。。。。

#进行数据可视化
import matplotlib.pyplot as plt
plt.plot(highs, c='red')
#设置图形格式
plt.title('Daily high temperatures , July 2014', fontsize = 18)
plt.xlabel('',fontsize = 12)
plt.ylabel('Temperatures (F)',fontsize =12)
plt.tick_params(axis='both', which= 'major', labelsize = 10)
plt.show()
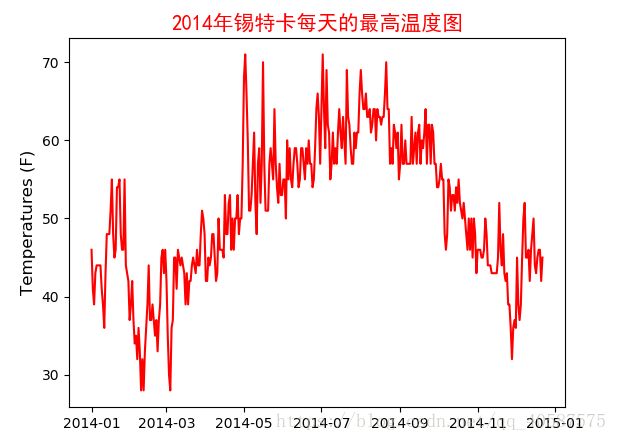
3,,214年一整年的sitka的温度数据集,模块为: sitka_wheter.py
#coding=gbk
#《pyhotn 编程:从入门到实践》 第16章:下载数据
import csv
from datetime import datetime
from matplotlib.font_manager import FontProperties
filename = r'D:\datasets\sitka_weather_2014.csv'
with open(filename) as f:
    reader = csv.reader(f)
    header_row = next(reader)     # next 返回文件的第一行, 包括文件头,即表名
    #print(header_row)
#     for index , column_header in enumerate(header_row):    #使用 enumerate 迭代器输出 特征值
#         print(index, column_header)

#读取文件中的最高气温数据集,   增加横轴为时间表示
    highs ,dates= [], []  #创建一个列表
    for row in reader:
        current_time = datetime.strptime(row[0], '%Y-%m-%d')   #增加时间的列表,将字符串类型转换成datatime对象
        dates.append(current_time)

        high = int(row[1])  #将列表中的字符串 转换成数值型
        highs.append(high)            #获得第二行的 的数据, 即每天的最高温度

#进行数据可视化
import matplotlib.pyplot as plt
plt.plot(dates, highs, c='red')
#设置图形格式
plt.title('2014年锡特卡每天的最高温度图', fontsize = 15, FontProperties= 'SimHei',color='red')
plt.xlabel('',fontsize = 12)
plt.ylabel('Temperatures (F)',fontsize =12)
plt.tick_params(axis='both', which= 'major', labelsize = 10)
plt.show()
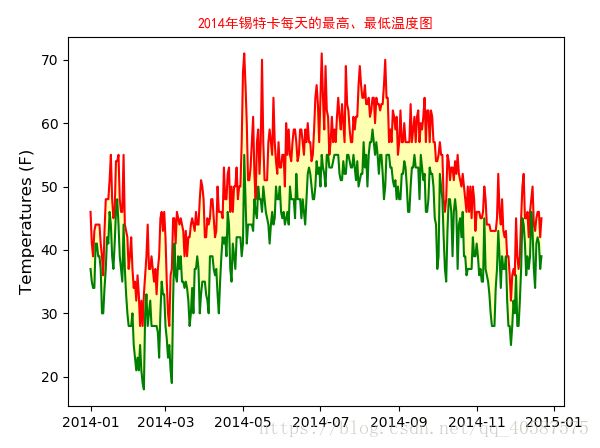
4,2014年锡特卡的最高温度与最低温度的对比:
#coding=gbk
#《pyhotn 编程:从入门到实践》 第16章:下载数据
import csv
from datetime import datetime
from matplotlib.font_manager import FontProperties
filename = r'D:\datasets\sitka_weather_2014.csv'
with open(filename) as f:
    reader = csv.reader(f)
    header_row = next(reader)     # next 返回文件的第一行, 包括文件头,即表名
    #print(header_row)
#     for index , column_header in enumerate(header_row):    #使用 enumerate 迭代器输出 特征值
#         print(index, column_header)
# 0 AKDT        阿拉斯加时间
# 1 Max TemperatureF    每天的最高温度
# 2 Mean TemperatureF
# 3 Min TemperatureF
# 4 Max Dew PointF
#.........
# 22  WindDirDegrees
#读取文件中的最高气温数据集,   增加横轴为时间表示
    highs ,dates, lows= [], [], [] #创建一个列表
    for row in reader:
        current_time = datetime.strptime(row[0], '%Y-%m-%d')   #增加时间的列表,将字符串类型转换成datatime对象
        dates.append(current_time)

        high = int(row[1])  #将列表中的字符串 转换成数值型
        highs.append(high)            #获得第二行的 的数据, 即每天的最高温度

        low = int(row[3])
        lows.append(low)        #获取每天的最低温度

#进行数据可视化
import matplotlib.pyplot as plt
plt.plot(dates, highs, c='red')

plt.plot(dates, lows, c='green')

#给图表的区域着色,  alpha表示透明度,0表示完全透明
plt.fill_between(dates, highs, lows, facecolor= 'yellow', alpha= 0.3)

#设置图形格式
plt.title('2014年锡特卡每天的最高、最低温度图', fontsize = 15, FontProperties= 'SimHei',color='red')
plt.xlabel('',fontsize = 12)
plt.ylabel('Temperatures (F)',fontsize =12)
plt.tick_params(axis='both', which= 'major', labelsize = 10)
plt.show()
![]()


