利用PCA对数据降维并处理Iris数据集(附Python代码)
PCA步骤
假设数据的存储方式为,每一行一个样本,每一列一个特征,这符合绝大多数我们处理的数据的形式。
- 去均值化,将数据 d a t a r o w s , c o l s data_{rows, cols} datarows,cols的每一列减去其自身列的均值,即每一组特征减去该组特征的均值。
- 求协方差矩阵,这里的data是上一步去均值化后的数据矩阵, n s a m p l e s n_{samples} nsamples是样本的个数, c o v = ( d a t a T d a t a ) / n s a m p l e s cov = (data^T data) / n_{samples} cov=(dataTdata)/nsamples。
- 对协方差矩阵进行svd分解得到U(矩阵)、S(奇异值)、V(矩阵)。
- 将去均值化后的原数据矩阵,即第二步说到的data右乘U矩阵,即 r e s u l t = d a t a ∗ U result = data * U result=data∗U。
注意:在将这个步骤的结果与sklearn中的PCA模块结果比较的时候,发现结果相差一个负号,但个人认为不影响数据处理,而且在有关文章中没有看到对于这个负号的讨论,即如果想得到库函数处理的结果,需要对上步的最终结果取负。
用经过以上步骤最终得到的结果,前n列即最优秀的前n个features进行训练,达到降维的效果。因为这时的features已经是按照"优秀"程度从左到右排列了。在上面第四步也可以直接取U的前n列进行计算,达到简化计算的目的,这样最后得到的直接就是最"优秀"的前n个features。
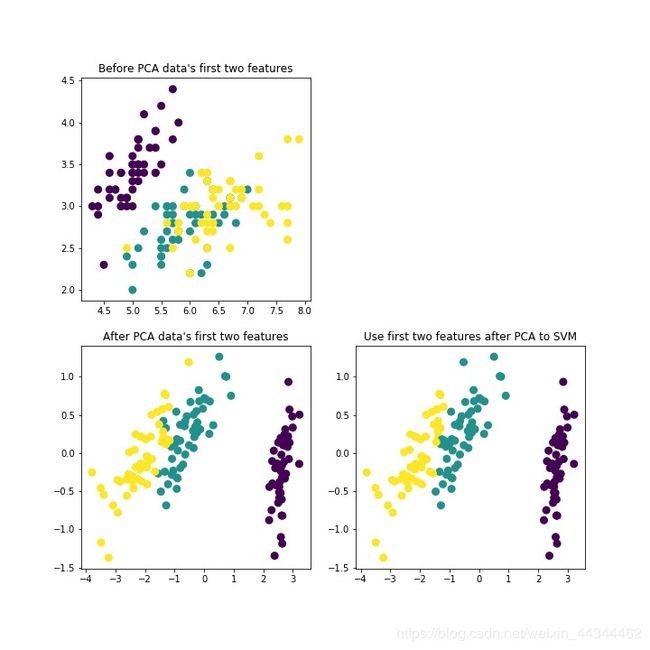
Iris(鸢尾花)数据集PCA测试结果
利用PCA后的前两维度特征对鸢尾花数据集分类精度为:
score= 0.9533333333333334
Show me the code
导包
# 载入sklearn数据集
from sklearn import datasets
# svm分类器
from sklearn import svm

import matplotlib.pyplot as plt
import numpy as np
载入数据
# 载入鸢尾花数据集
x_true = datasets.load_iris().data.astype("float64")
y_true = datasets.load_iris().target.reshape(-1, 1).astype("float64")
PCA模块
# PCA处理x_true
def PCA_DATA(x_true):
    # 去均值化
    x_true -= np.mean(x_true, axis=0)

    # 求协方差矩阵
    cov = np.dot(x_true.T, x_true) / x_true.shape[0]

    # 对协方差矩阵进行SVD分解
    U, S, V = np.linalg.svd(cov)
    x_true_rot = np.dot(x_true, U)

    return x_true_rot
处理Iris数据集
# PCA处理x_true
def PCA_DATA(x_true):
    # 去均值化
    x_true -= np.mean(x_true, axis=0)

    # 求协方差矩阵
    cov = np.dot(x_true.T, x_true) / x_true.shape[0]

    # 对协方差矩阵进行SVD分解
    U, S, V = np.linalg.svd(cov)
    x_true_rot = np.dot(x_true, U)

    return x_true_rot

# 原始数据的前两维features
plt.figure(figsize=(10, 10))
plt.subplot(221)
plt.title("Before PCA data's first two features")
plt.scatter(x_true[:, 0], x_true[:, 1],
			c= y_true.reshape(y_true.shape[0], ), lw= 3)

# 利用自定义PCA模块处理数据
x_true_rot = PCA_DATA(x_true)

# PCA处理后数据的前两维features
plt.subplot(223)
plt.title("After PCA data's first two features")
plt.scatter(x_true_rot[:, 0], x_true_rot[:, 1],
			c= y_true.reshape(y_true.shape[0], ), lw= 3)

# 利用PCA后的前两维features对数据进行SVM分类
clf = svm.SVC()
clf.fit(x_true_rot[:, 0:2], y_true.reshape(y_true.shape[0], ))
y_predict = clf.predict(x_true_rot[:, 0:2])
# 绘制SVM分类结果
plt.subplot(224)
plt.title("Use first two features after PCA to SVM")
plt.scatter(x_true_rot[:, 0], x_true_rot[:, 1],
			c= y_predict.reshape(y_true.shape[0], ), lw= 3)
plt.savefig("./1-PCA数据降维效果图.jpg")
plt.show()

# 评价分类准确率
score = clf.score(x_true_rot[:, 0:2], y_true)
print("利用PCA后的前两维度特征对鸢尾花数据集分类精度为:")
print("score= ", score)
