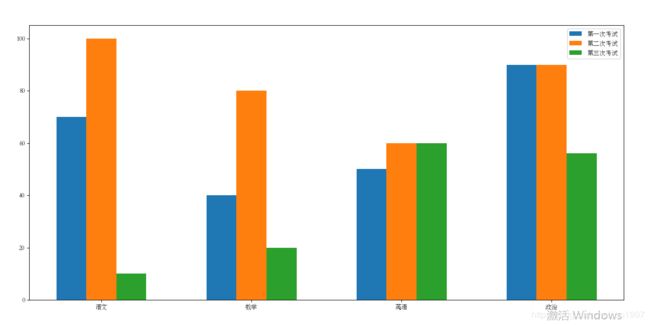
python matplotlib画条形图、添加图例
跟着B站学习,每天下班回来练一个小时的代码技能。
方法:1.5倍速看一遍视频,理解后自己敲。不懂就度娘~
上代码:
from matplotlib import pyplot as plt

#高三学生分别在三次模考中的分析\用到多次就把他提出来当变量
plt.rcParams['font.sans-serif']=['STSong'] #设置中文
a = ['语文','数学','英语','政治']
b_1 = [70,40,50,90]
b_2 = [100,80,60,90]
b_3 = [10,20,60,56]

bar_width = 0.2
x_1 = list(range(len(a)))
x_2 = [i+bar_width for i in x_1]
x_3 = [i+bar_width*2 for i in x_1]

plt.figure(figsize=(20,8),dpi=80)
plt.bar(range(len(a)),b_1,width=bar_width,label='第一次考试')
plt.bar(x_2,b_2,width=bar_width,label='第二次考试')
plt.bar(x_3,b_3,width=bar_width,label='第三次考试')
plt.legend(loc='upper right')
plt.xticks(x_2,a)

plt.show()
解析:
设置图例用法:plt.legend(loc=‘upper right’) ,参数是位置。

其他:虽然很迷茫,但是做好眼前事。加油~