Pandas学习(数据读取、索引、数据预处理、自定义函数)
Pandas 是python的一个数据分析包,最初由AQR Capital Management于2008年4月开发,并于2009年底开源出来,目前由专注于Python数据包开发的PyData开发team继续开发和维护,属于PyData项目的一部分。Pandas最初被作为金融数据分析工具而开发出来,因此,pandas为时间序列分析提供了很好的支持。 Pandas的名称来自于面板数据(panel data)和python数据分析(data analysis)。panel data是经济学中关于多维数据集的一个术语,在Pandas中也提供了panel的数据类型。
数据结构:
Series:一维数组,与Numpy中的一维array类似。二者与Python基本的数据结构List也很相近。Series如今能保存不同种数据类型,字符串、boolean值、数字等都能保存在Series中。
Time- Series:以时间为索引的Series。
DataFrame:二维的表格型数据结构。很多功能与R中的data.frame类似。可以将DataFrame理解为Series的容器。
Panel :三维的数组,可以理解为DataFrame的容器。
Panel4D:是像Panel一样的4维数据容器。
PanelND:拥有factory集合,可以创建像Panel4D一样N维命名容器的模块。
1.数据读取
这是一个csv文件
read_csv()
import pandas
info=pandas.read_csv('food_info.csv')
print(type(info))
print(info.dtypes)
pandas中,字符型数据dtypes显示为object。DataFrame二维表格行数据。
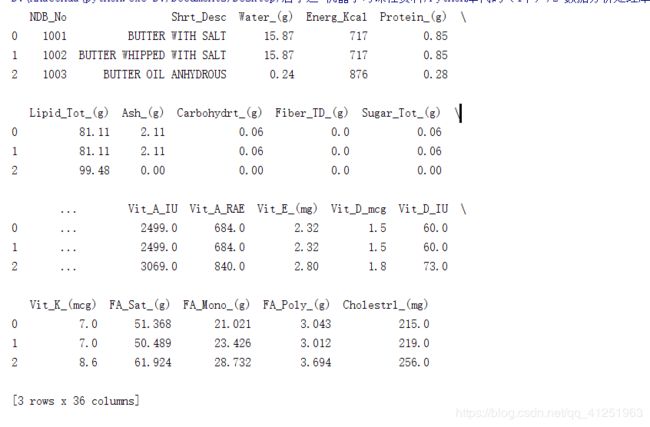
head()函数 默认显示前5条数据。里面以传入参可数!
import pandas
info=pandas.read_csv('food_info.csv')
#head()函数
print(info.head())
传入参数显示前3条数据
import pandas
info=pandas.read_csv('food_info.csv')
#head()函数
print(info.head(3))
tail()函数
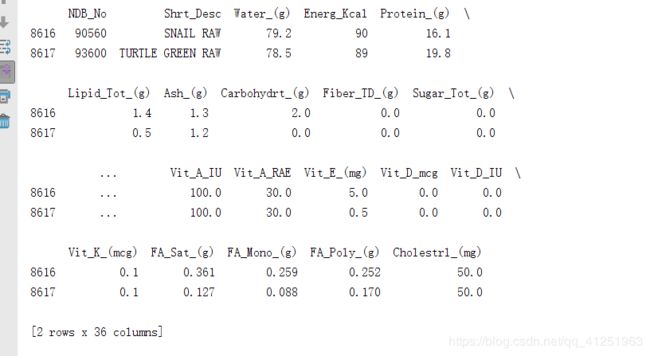
取后几条数据,与head()类似。
import pandas
info=pandas.read_csv('food_info.csv')
#tial()函数
print(info.tail(2))
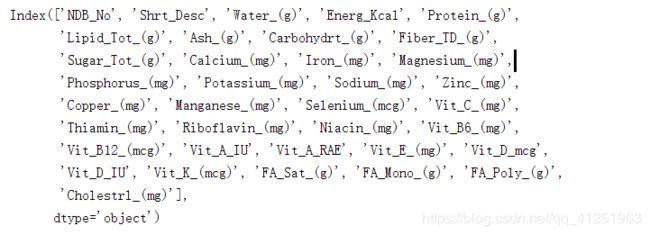
.columns获取csv文件所有列名:
import pandas
info=pandas.read_csv('food_info.csv')
#columns
print(info.columns)
.shape 数据规模,(样本条数,及样本指标) 。可以理解为有多少行,多少列。
import pandas
info=pandas.read_csv('food_info.csv')
print(info.shape)
2.取数据
.loc[0]取第一条数据
import pandas
info=pandas.read_csv('food_info.csv')
print(info.loc[0])
也可以类似于切片取数据
import pandas
info=pandas.read_csv('food_info.csv')
print(info.loc[3:6])
可以通过第一行列名直接拿取某一列数据
import pandas
info=pandas.read_csv('food_info.csv')
print(info['NDB_No'])
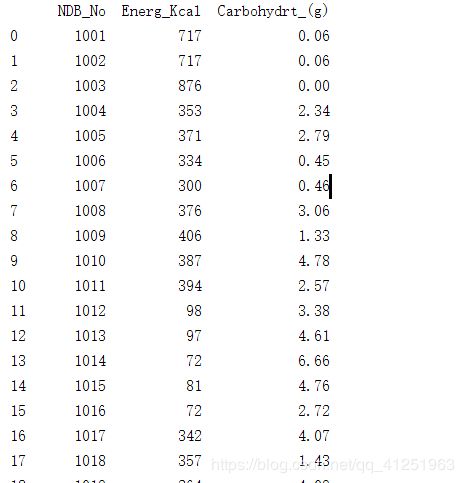
获取多个列名, 可以先把多个列名组成list结构,在获取
import pandas
info=pandas.read_csv('food_info.csv')
columns=['NDB_No','Energ_Kcal','Carbohydrt_(g)']
print(info[columns])
寻找列名中以g为结尾的数据:
import pandas
info=pandas.read_csv('food_info.csv')
#获取所有列名,转为list
col_names=info.columns.tolist()
print(col_names)

gram_columns=[]

for i in col_names:
    if i.endswith("(g)"):
        gram_columns.append(i)
gram_df=info[gram_columns]
print(gram_df)
将列名以mg(毫克)为结尾的数据,转化为以g(克)为结尾的数据:
对列中每一个值都执行除1000操作:
import pandas
info=pandas.read_csv('food_info.csv')

div_1000=info["Iron_(mg)"]/1000
print(div_1000)
维度一样的两个列进行组合,对应位置进行操作。
import pandas
info=pandas.read_csv('food_info.csv')

water_energy=info['Water_(g)']*info["Energ_Kcal"]
print(water_energy)
新建一列,并进行赋值
import pandas
info=pandas.read_csv('food_info.csv')
water_energy=info['Water_(g)']*info["Energ_Kcal"]
print(info.shape)
#新建一列,并进行赋值
info['water_energy']=water_energy
print(info.shape)
一些常用函数:
import pandas
info=pandas.read_csv('food_info.csv')
#获取某列最大值
max_calories=info['Energ_Kcal'].max()
print(max_calories)
#获取某列最小值
min_calories=info['Energ_Kcal'].min()
print(min_calories)
#获取某列均值
mean_calories=info['Energ_Kcal'].mean()
print(mean_calories)
进行排序操作
几种排序方式:
import pandas
info=pandas.read_csv('food_info.csv')
#默认从小到大排序
info.sort_values('Sodium_(mg)',inplace=True)
print(info['Sodium_(mg)'])

#从大到小排序,降序
info.sort_values('Sodium_(mg)',inplace=True,ascending=False)
print(info['Sodium_(mg)'])
这是另一个csv文件
import pandas
titanic_train=pandas.read_csv('titanic_train.csv')

age=titanic_train["Age"]
print(age.loc[0:10])
#判断是否是缺失值NAN
age_is_null=pandas.isnull(age)
print(age_is_null)
#当成索引,找所有缺失值
age_null_true=age[age_is_null]
print(age_null_true)
#当前缺失值长度
age_null_count=len(age_null_true)
print(age_null_count)
对缺失值进行处理:
import pandas
titanic_train=pandas.read_csv('titanic_train.csv')

#如果不进行预处理
mean_age=sum(titanic_train['Age'])/len(titanic_train['Age'])
print(mean_age)
运行结果:
![]()
对缺失值进行处理计算年龄均值:【pandas.isnull()判断是否有缺失值】
import pandas
titanic_train=pandas.read_csv('titanic_train.csv')
#去掉缺失值,计算平均年龄
age_is_null=pandas.isnull(titanic_train['Age'])

good_ages=titanic_train['Age'][age_is_null==False]
#print(good_ages)
correct_mean_age=sum(good_ages)/len(good_ages)
print(correct_mean_age)

#mean()方法
correct_mean_age_1=titanic_train['Age'].mean()
print(correct_mean_age_1)
运行结果与自带mean()方法运行结果一样。
pivot_table(index=,values=,aggfunc=)函数
import pandas
import numpy as np
titanic_train=pandas.read_csv('titanic_train.csv')

#Pclass 中Survived的平均值
passenger_survival=titanic_train.pivot_table(index='Pclass',values="Survived",aggfunc=np.mean)
print(passenger_survival)
#Pclass 中Age的平均值  如果不指定aggfunc,默认为aggfunc=np.mean
passenger_age=titanic_train.pivot_table(index="Pclass",values='Age')
print(passenger_age)

port_stats=titanic_train.pivot_table(index="Embarked",values=["Fare","Survived"],aggfunc=np.sum)
print(port_stats)
丢掉缺失值,定位具体位置值
import pandas
import numpy as np
titanic_train=pandas.read_csv('titanic_train.csv')

#丢掉缺失值
drop_na_columns=titanic_train.dropna(axis=1)
#Age','Sex'中如果有缺失值,丢掉
new_titanic_survival=titanic_train.dropna(axis=0,subset=['Age','Sex'])
#print(new_titanic_survival)


#定位具体位置值
row_index_83_age=titanic_train.loc[83,"Age"]
row_index_1000_pclass=titanic_train.loc[766,"Pclass"]
print(row_index_83_age,row_index_1000_pclass)
排序,重新设置索引
import pandas
titanic_train=pandas.read_csv('titanic_train.csv')

#排序
new_titanic=titanic_train.sort_values("Age",ascending=False)
print(new_titanic[0:10])
#重新设置索引
titanic_reindexed=new_titanic.reset_index(drop=True)
print("*****************************")
print(titanic_reindexed[0:10])
运行结果:
自定义函数 apply
import pandas
titanic_train=pandas.read_csv('titanic_train.csv')
#自定义函数
#返回第一百行数据
def hundredth_row(column):
    hundredth_item=column.loc[99]
    return hundredth_item
hundredth_row=titanic_train.apply(hundredth_row)
print(hundredth_row)
第一百行数据:
import pandas
titanic_train=pandas.read_csv('titanic_train.csv')
#自定义函数
#缺失值个数
def not_null_count(column):
    column_null=pandas.isnull(column)
    null=column[column_null]
    return len(null)
colimn_null_count=titanic_train.apply(not_null_count)
print(colimn_null_count)
import pandas
titanic_train=pandas.read_csv('titanic_train.csv')
#自定义函数
#标记年龄是否成年
def generate_age_label(row):
    age=row['Age']
    if pandas.isnull(age):
        return "unkown"
    elif age<18:
        return "minor"
    else:
        return "adult"
age_label=titanic_train.apply(generate_age_label,axis=1)
print(age_label)
成年人与小孩获救几率
import pandas
titanic_train=pandas.read_csv('titanic_train.csv')
#自定义函数
#标记年龄是否成年
def generate_age_label(row):
    age=row['Age']
    if pandas.isnull(age):
        return "unkown"
    elif age<18:
        return "minor"
    else:
        return "adult"
age_label=titanic_train.apply(generate_age_label,axis=1)
#print(age_label)

titanic_train['age_labels']=age_label
age_group_survival=titanic_train.pivot_table(index="age_labels",values="Survived")
print(age_group_survival)


