Chapter 2 Data Exploration
目录
1. What is Data:
A. Data Types
B. Record Data
C. Types of Attributes
2. Data Exploration:
A. About Data Quality
B. Preprocessing
① Quality
② Sampling
③ Attribute Selection
④ Dimensionality Reduce
⑤ Discretization:Binning
⑥ Statistics
⑦ Visualization
1. What is Data:
A. Data Types: Document Data、Transaction Data、Graph Data、Sequence Data、Spatial-Temporal Data、Record Data、 Data Matrix
Spatial  [ˈspeɪʃl]   空间的
Temporal [ˈtempərəl] 时间的
B. Record Data:
Collection of data objects and their attributes
An attribute is a property or characteristic of an Object
A collection of attributes describe an Object
 property        [ˈprɑːpərti]       特性
 characteristic  [ˌkærəktəˈrɪstɪk]  特征
C. Types of Attributes:
① Discrete Attribute and Continus Attribute
② Nominal Attribute and Ordinal Attribute
③ Interval Attribute and Ratio Attribute
Nominal  [ˈnɒmɪnl]   名义
Ordinal  [ˈɔːrdənl]  序数

Interval [ˈɪntəvl]   区间
Ratio    [ˈreɪʃioʊ]  比率
2. Data Exploration:
A. About Data Quality: Data in the real world is dirty.
① incomplete: lacking attribute values
② noisy:data errors, outliers
③ inconsistent: discrepancy between duplicate records
outlier      [ˈaʊtlaɪər]    离群的, 异常的
discrepancy  [dɪsˈkrepənsi] 差异,不一致
duplicate    [ˈduːplɪkeɪt]  完全一样的,复制的
B. Preprocessing:
① Quality:Handle missing values (Ignore or Estimate)、Remove Outliers、Resolve Confilcts (Merge or Identify)
② Sampling:
Key principle:using a sample will work almost as well as using the entire data sets, if the sample is representative;
A sample is representative if it has approximately the same property as the origin set of data
Types of Sampling:Simple Random Sampling、Sampling without replacement、Sampling with repacement、
Stratified Sampling
Sampling Rate:
③ Attribute Selection:Redundant Attributes and Irrelevant Attributes
stratified  [ˈstrætɪfaɪd] 分层的
redundant   [rɪˈdʌndənt]  冗余的
irrelevant  [ɪˈreləvənt]  无关的
④ Dimensionality Reduce:
Reduce the number of attributes by creating a new set of attributes.
⑤ Discretization:Binning
Convert numerical data into categorical data
Divides the range into N intervals
⑥ Statistics:
Center Measurement:Mean、Median
Frequency Distribution:Mode
Variability Measurement:Variance,Standard Devitation
⑦ Visualization:
Visualization is the conversion of data into a visual or tabular format
so that characters of the data and the relations among data items or attributes can be analyzed or reported
Visualization of data is one of the most powerful and appealing techniques for Data Exploration
dimensionality [dɪˌmɛnʃəˈnæləti] 维度
discretization   离散化
binning   [ˈbɪnɪŋ]  装箱
categorical  [ˌkætəˈɡɔːrɪkl] 分类的
mode  众数
devitation  偏差
tabular [ˈtæbjələr] 表格式的
appealing  吸引人的
Examples Of Visualization:
Sea Surface Temperature
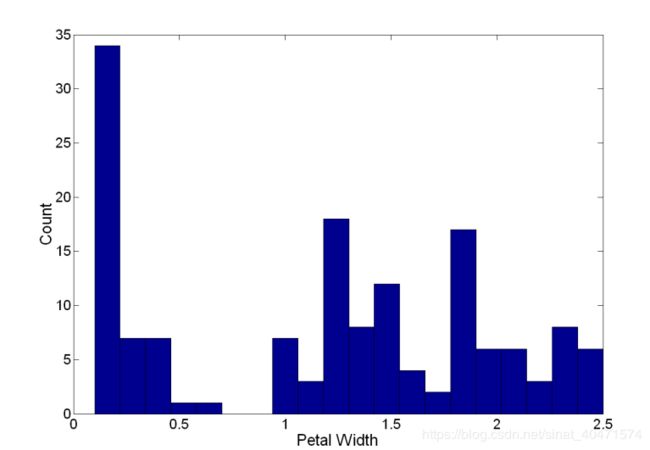
Histogram:[ˈhɪstəɡræm] 直方图
Box Plots:方块图
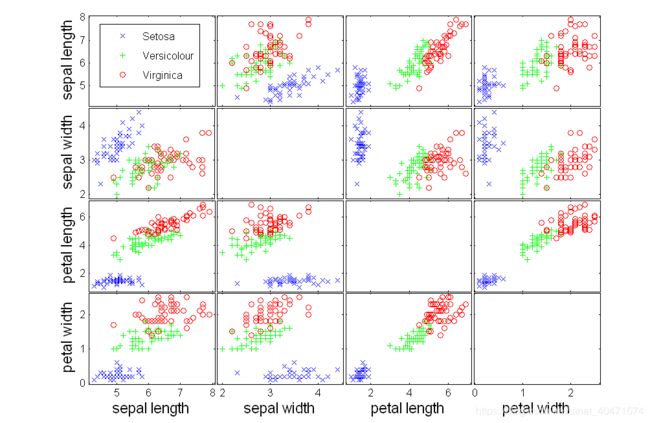
Scatter Plot:散点图
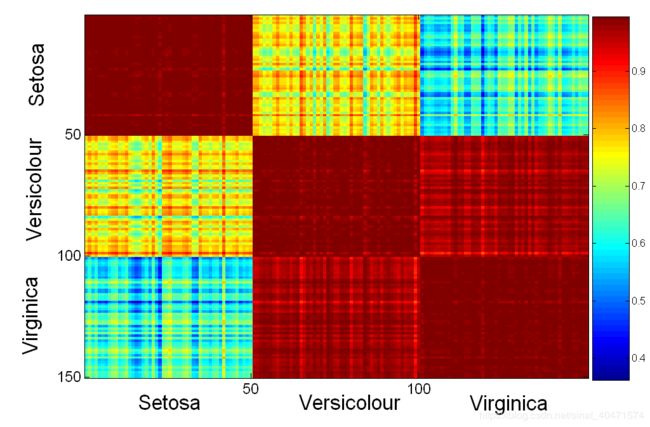
Correlation Matrix:关联矩阵


