Python美团商铺数据分析
一、研究问题
用Python对爬取得到的美团上海地区商铺数据进行分析,通过对商铺的人均消费价格、评分等进行分析。
二、分析步骤
1)数据清洗
2)数据可视化
3)聚类模型建立
4)模型分析 ·
5)结论
三、具体分析过程
1.导入数据、数据清洗
import pandas as pd
data = pd.read_csv('meituan.csv')
data_5 = data[['dish_type','restaurant_name','price','star','comment_num']]
data_5.to_csv('data_5.csv')
data_location = data['location']

data_location = data_location.str.split(u'区',expand=True)[0]
data_location.to_csv('location.csv')

data_location = pd.read_csv('location.csv',names=['location'])
data_location = data_location['location'] + u'区'
data_location.to_csv('location.csv')

data_location = pd.read_csv('location.csv',names=['location'])
data_location['location'] = data_location[data_location['location'].str.len()<=4]
data_location = data_location.fillna(u'其他区')
print(data_location)
data_location.to_csv('location.csv')

data_all = data_5.join(data_location)
data_all.to_csv('meituan_cleaned.csv')
print(data_all)
2.数据可视化
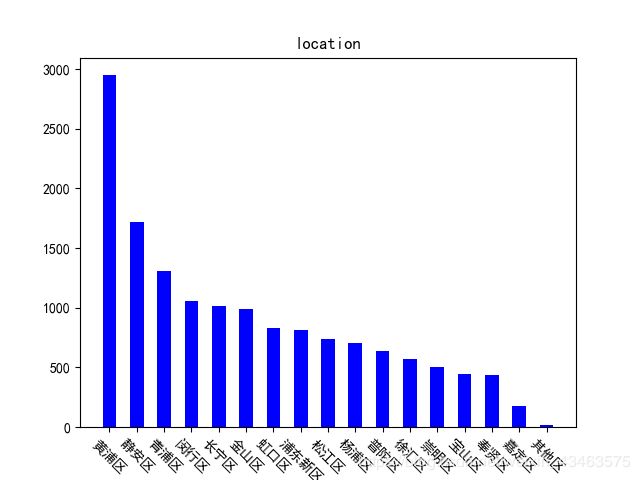
1)各个区店铺分布情况
data = pd.read_csv('meituan_cleaned.csv')
data_location = data['location']
result_location = Counter(data_location)
print(result_location)
index_location = list(result_location.keys())
index_location.sort(reverse=True)
print(index_location)
count_location = list(result_location.values())
count_location.sort(reverse=True)
print(count_location)
plt.bar(index_location,count_location,width=0.5,color='b')
plt.title('location')
plt.xticks(rotation=-45)
data = pd.read_csv('meituan_cleaned.csv')
data_dishtype = data['dish_type']
result_dishtype = Counter(data_dishtype)
print(result_dishtype)

index_dishtype = list(result_dishtype.keys())
index_dishtype.sort(reverse=True)
count_dishtype = list(result_dishtype.values())
count_dishtype.sort(reverse=True)
plt.bar(index_dishtype,count_dishtype,width=0.5,color='b')
pl.xticks(rotation=-70)
plt.title('dish_type')
data = pd.read_csv('meituan_cleaned.csv')
data_dsp = data[['star','dish_type','price']]
print(type(data_dsp))
print(data_dsp)
data_typedsp = data_dsp.groupby(['dish_type'])[['star','price']].mean()
print(type(data_typedsp))
print(data_typedsp)

dish_type =data_typedsp.index
dish_type = list(dish_type)
star_mean = data_typedsp[data_typedsp.columns[0]]
star_mean = list(star_mean)
price_mean = data_typedsp[data_typedsp.columns[1]]
price_mean = list(price_mean)
print(dish_type)
print(star_mean)
print(price_mean)

line1,=plt.plot(dish_type,star_mean,linestyle='-',color='b',marker='o',label='avgstar')
pl.xticks(rotation=-90)

plt.twinx()
line2,=plt.plot(dish_type,price_mean,linestyle='--',color='g',marker='v',label='avgprice')
pl.xticks(rotation=-90)
plt.title('avgstar and avgprice')

plt.legend(loc=0, ncol=2)
plt.legend([line1,line2], ['avgstar','avgprice'])
pic_output = 'Avg_price_star_plot'
plt.savefig(u'%s.png' %(pic_output), dpi=500,bbox_inches='tight')
data = pd.read_csv('meituan_cleaned.csv')
data_dsc = data[['dish_type','star','comment_num']]
print(data_dsc)

data_typeds = data_dsc.groupby(['dish_type'])['star'].mean()
print(data_typeds)
data_typedc = data_dsc.groupby(['dish_type'])['comment_num'].sum()
print(data_typedc)
data_typedsc = pd.merge(data_typeds,data_typedc,how='left',on='dish_type')
print(data_typedsc)

dish_type = data_typedsc.index
dish_type = list(dish_type)
print(dish_type)
star_mean = data_typedsc[data_typedsc.columns[0]]
star_mean = list(star_mean)
print(star_mean)
comment_num = data_typedsc[data_typedsc.columns[1]]
comment_num = list(comment_num)
print(comment_num)

plt.ylim([0,5])

line1,=plt.plot(dish_type,star_mean,linestyle='--',color='g',marker='o',label='avgstar')
plt.xticks(rotation=-90)

plt.twinx()
plt.bar(dish_type,comment_num,width=0.5,color='b')

# plt.xticks(rotation=-90)
plt.legend(loc=0,ncol=1)
plt.legend([line1],['avgstar','avcomment'])
plt.title('Avgstar and Comment_num')
4.聚类模型构建
data = pd.read_csv('meituan_cleaned.csv',index_col='restaurant_name')
data = data[['star','price','comment_num']]

data = (data-data.min())/(data.max()-data.min())
# data = data.reset_index()

data.to_csv('meituan_standard.csv')
data = pd.read_csv('meituan_standard.csv',index_col='restaurant_name')
print(data)

Z = linkage(data, method='ward', metric='euclidean')
P = dendrogram(Z, 0)
pic_output = 'cluster'
plt.title(u'谱系聚类图')
plt.savefig(u'%s.png' %(pic_output),dpi=500)

'''层次聚类算法'''

data = pd.read_csv('meituan_standard.csv', index_col='restaurant_name')
# print(data)

model = AgglomerativeClustering(n_clusters=k, linkage='ward')
model.fit(data)


r = pd.concat([data, pd.Series(model.labels_, index=data.index)], axis=1)
r.columns = list(data.columns) + [u'聚类类别']
print(r)


style = ['ro-','go-','bo-']
title = [u'商铺圈类别1',u'商铺圈类别2',u'商铺圈类别3']
xlabels = ['star','price','comment_num']
pic_output = 'type_'


for i in range(k):
    plt.figure()
    tmp = r[r[u'聚类类别']==i].iloc[:,:3]
    for j in range(len(tmp)):
        plt.plot(range(1,4), tmp.iloc[j], style[i])

    plt.xticks(range(1,4), xlabels, rotation=20)
    plt.title(title[i])
    plt.subplots_adjust(bottom=0.15)
    plt.savefig(u'%s%s.png' %(pic_output,i),dpi=500

plt.tight_layout()
plt.style.use('ggplot')
plt.show()
5.模型分析


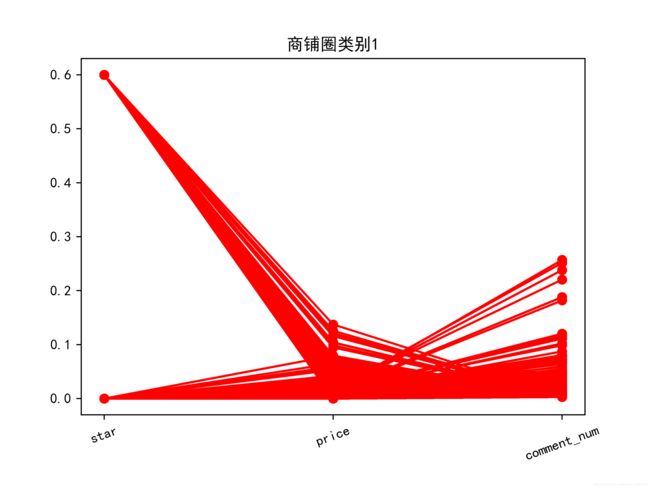
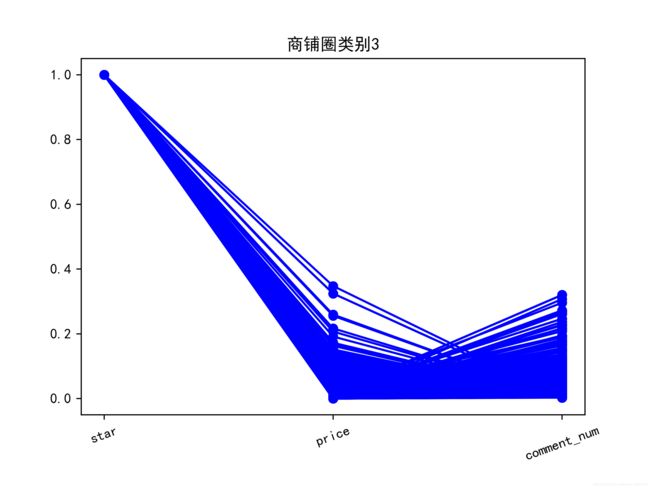
对于商铺圈类别 1,这部分商铺中评分指数呈两极分化,说明了这一类商铺 圈中的商铺评价呈两极分化。对于商铺圈类别 2,这部分商铺中的评分指数,人均消费价格,和评论数量都较高,说明消费者对这一类商铺圈中的商铺都比较满 意,评价热情也较高,这一类商铺圈中的商铺受顾客欢迎度高。对于商铺圈 3, 这部分商铺圈中的商铺评分指数高,说明了其商铺总体不错。
6.结论
1.上海黄浦区和静安区的商铺数量最多,因此餐饮行业发展也比较迅速,反 映出经济比较发达。
2. 上海地区入驻美团平台的商铺美食类型以香锅烤鱼、韩国料理、西餐、西 北菜、蛋糕甜点、自助餐、烧烤烤肉、火锅、海鲜较多。
3. 上海地区大部分美食平均评分都不错,普遍 4 分左右,其中新疆菜相对 较低,同时反映了新疆菜在上海受欢迎程度不佳。
4.从聚类结果商铺圈类别 2 可以看出,此商铺圈中的商铺受欢迎程度较高。
附:
1.数据仅供学习交流使用
2.数据和完整代码保存在Github中
https://github.com/Jie-Wang-310/meituan_data_analysis


