opencv:matplotlib.pyplot模块
1.subplot函数
模块matplotlib.pyplot提供了函数matplotlib.pyplot.subplot()用来向当前窗口内添加一个子窗口对象。该函数的语法格式为:
matplotlib.pyplot.subplot(nrows,ncols,index)
nrows为行数。 ncols为列数。 index为窗口序号(序号是从1开始的)
import cv2
import matplotlib.pyplot as plt
img=cv2.imread("D:/dog.jpg",0)
equ=cv2.equalizeHist(img)
plt.figure("subplot")
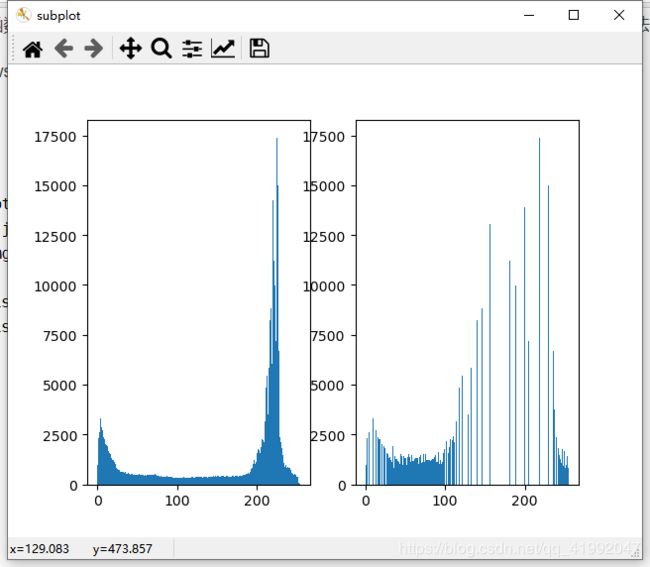
plt.subplot(121),plt.hist(img.ravel(), 256)
plt.subplot(122),plt.hist(equ.ravel(), 256)
2.matplotlib.pyplot.imshow()
matplotlib.pyplot.imshow(X,cmap=None)
式中:X为图像信息,可以是各种形式的数值,cmap表示色彩空间,该值是可选项,默认值为null,默认使用RGB(A)色彩空间。
import cv2
import matplotlib.pyplot as plt
img=cv2.imread("D:/dog.jpg")
imgRGB=cv2.cvtColor(img, cv2.COLOR_BGR2RGB)
plt.figure("xianshi")
plt.subplot(121)
plt.imshow(img),plt.axis('off')
plt.subplot(122)
plt.imshow(imgRGB),plt.axis('off')
import cv2
import matplotlib.pyplot as plt
o=cv2.imread("d:/dog.jpg")
g=cv2.cvtColor(o,cv2.COLOR_BGR2GRAY)
plt.figure("huidu")
plt.subplot(221)
plt.imshow(o),plt.axis('off')
plt.subplot(222)
plt.imshow(o,cmap=plt.cm.gray),plt.axis('off')
plt.subplot(223)
plt.imshow(g),plt.axis('off')
plt.subplot(224)
plt.imshow(g,cmap=plt.cm.gray),plt.axis('off')
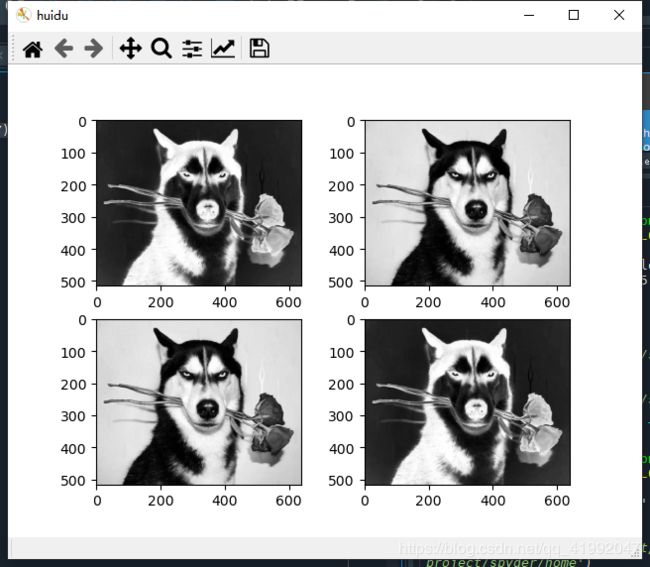
● 左上角是原始图像。因为没有对读取的图像进行通道转换,直接将其作为彩色图像显示,所以显示结果中通道顺序是错乱的,图像没有正常显示。
● 右上角是我们尝试将彩色图像作为原始图像,将其色彩空间参数设置为“cmap=plt.cm.gray”,让彩色图像以灰度图像展示的结果,图像显示失败。
● 左下角是使用默认色彩空间参数,显示灰度图像的结果。这种情况下,灰度图像会采用默认的RGB模式显示。可以看到,图像没有正常显示。
● 右下角是将灰度图像作为原始图像,并将其色彩空间参数设置为“cmap=plt.cm.gray”而显示的灰度图像,图像显示正常。
import cv2
import matplotlib.pyplot as plt
o=cv2.imread('d:/dog.jpg')
g=cv2.cvtColor(o,cv2.COLOR_BGR2GRAY)
plt.figure('huidu')
plt.subplot(221)
plt.imshow(g,cmap=plt.cm.gray_r)
plt.subplot(222)
plt.imshow(g,cmap=plt.cm.gray)
plt.subplot(223)
plt.imshow(g,cmap='gray')
plt.subplot(224)
plt.imshow(g,cmap='gray_r')
色彩空间参数cmap的参数值“plt.cm.gray_r”及“gray_r”中的“r”是英文“reverse”的缩写,表示逆转的意思。


