可视化库seaborn:swarmplot、tsplot、PairGrid 、violinplot、barplot、boxplot、palplot、`Facetgrid、catplot、heatmap
seaborn 库是对matplotlib库的封装。
1 布局&风格设置:set_style()
import seaborn as sns   # 导入模块
import numpy as np
import matplotlib as mpl
import matplotlib.pyplot as plt
%matplotlib inline
def sinplot(flip=1):
    x = np.linspace(0, 14, 100)  # 产生[0,14]上的100个点
    for i in range(1, 7):  # 画6条线
        plt.plot(x, np.sin(x + i * .5) * (7 - i) * flip)
sinplot()

sns.set()使用seaborn默认的参数/风格组合;seaborn 的5种主题风格如下:
darkgrid 、 whitegrid 、 dark、 white、 ticks
sns.set_style("whitegrid")  # 风格设置 为白色格子
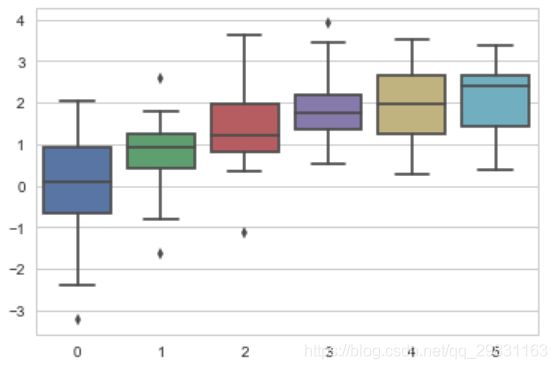
data = np.random.normal(size=(20, 6)) + np.arange(6) / 2
sns.boxplot(data=data)  # 盒图/箱线图
常用的绘图方法
sns.set_style("dark") 背景为深色,没有刻度线
sns.set_style("ticks") # 加刻度线
sns.despine() # 指定其它参数,去掉上方和右边的线段
sns.despine(left=True) # 隐藏左边的轴
四种布局设置 set_context()
`sns.set_context("paper") `
sns.set_context("talk")
sns.set_context("poster")
sns.set_context("notebook", font_scale=1.5, rc={"lines.linewidth": 2.5})  # font_scale字体的大小
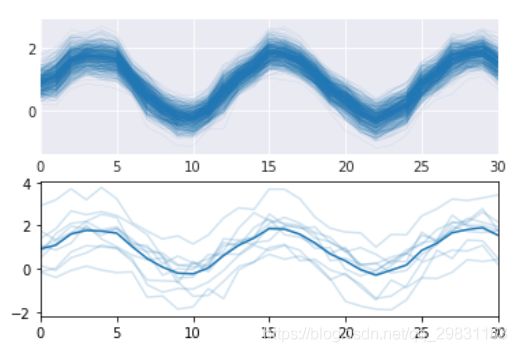
tsplot:时间线图表
| 参数 | |
|---|---|
| data | 作图的数据 |
| err_style | 误差数据风格,可选:ci_band, ci_bars, boot_traces, boot_kde, unit_traces, unit_points |
| interpolate | bool,是否显示连线 |
| ci | 误差区间 |
| n_boot | 迭代次数 |
%matplotlib inline
import numpy as np
import pandas as pd
import seaborn as sns
from matplotlib import pyplot as plt
np.random.seed(22)

#不发出警告
import warnings
warnings.filterwarnings('ignore')

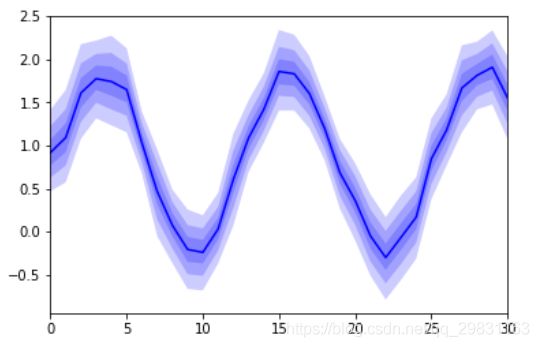
x = np.linspace(0, 15, 31)
data = np.sin(x) + np.random.rand(10, 31) + np.random.randn(10, 1)
ax = sns.tsplot(data = data,
           err_style='ci_band', #误差数据风格,可选:ci_band, ci_bars, boot_traces,
           #boot_kde, unit_traces, unit_points
           interpolate = True,  #设置连线
           ci = [40, 70, 90],   #设置误差区间
           color = 'b'          #设置颜色
           )
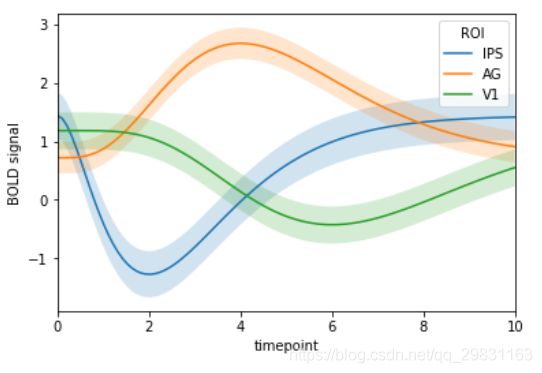
gammas = sns.load_dataset("gammas")
gammas.head(3)
ax = sns.tsplot(time = 'timepoint',    #时间数据, x轴
           value = 'BOLD signal', #y轴value
           unit = 'subject',      #拆分,默认参数
           condition = 'ROI',     #分类
           data = gammas
           )
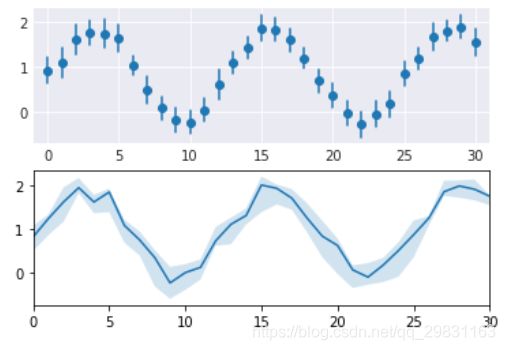
with sns.axes_style("darkgrid"):
    plt.subplot(2,1,1)
    sns.tsplot(data=data, err_style="ci_bars", interpolate=False)
plt.subplot(2,1,2)
sns.tsplot(data=data, estimator=np.median)
with sns.axes_style("darkgrid"):
    plt.subplot(2,1,1)
    sns.tsplot(data=data, err_style="boot_traces", n_boot=500)
plt.subplot(2,1,2)
sns.tsplot(data=data, err_style="unit_traces")
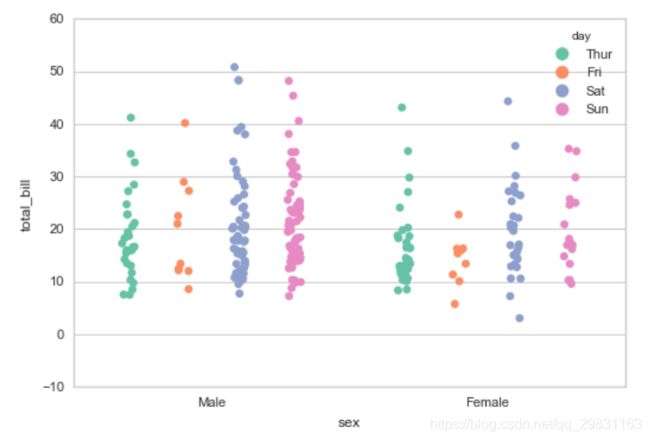
stripplot(): 散点图
按照不同类别对样本数据进行分布散点图绘制;通过hue参数再分类; palette 设置调色盘
sns.stripplot(x="sex", y="total_bill", hue="day",
              data=tips, jitter=True,
              palette="Set2",  # 设置调色盘
              dodge=True,  # 是否拆分
             )
sns.stripplot(x="day", y="total_bill", data=tips,jitter = True,
              order = ['Sat','Sun'])
# order → 筛选类别
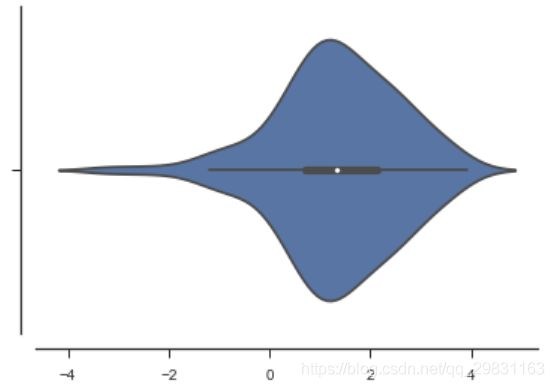
画小提琴图
#f, ax = plt.subplots()
sns.violinplot(data)   # 小提琴图
sns.despine(offset=10)   # offset 指定图形离轴线的距离
sinplot
为子图设置不同的风格:用with域
with sns.axes_style("darkgrid"):
    plt.subplot(211)
    sinplot()
plt.subplot(212)
sinplot(-1)
2 调色板
可视化图的颜色很重要!
color_palette()能传入任何Matplotlib所支持的颜色 ;不写参数则默认颜色
set_palette()设置所有图的颜色
6个默认的颜色循环主题:deep, muted, pastel, bright, dark, colorblind
sns.set(rc={"figure.figsize": (6, 6)})
current_palette = sns.color_palette()
sns.palplot(current_palette)
当分类的类别数大于6时,最简单的方法就是在一个圆形的颜色空间中画出均匀间隔的颜色(这样的色调会保持亮度和饱和度不变)。这是大多数的当他们需要使用比当前默认颜色循环中设置的颜色更多时的默认方案。最常用的方法是使用hls的颜色空间,这是RGB值的一个简单转换。
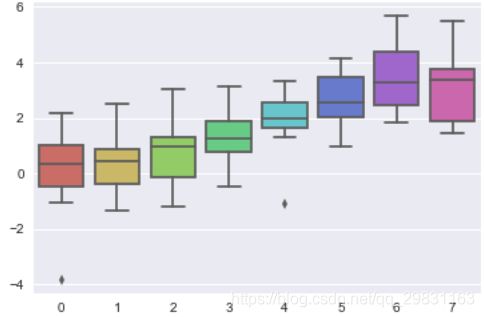
画8种渐变色的盒图
data = np.random.normal(size=(20, 8)) + np.arange(8) / 2
sns.boxplot(data=data,palette=sns.color_palette("hls", 8))  # 8种颜色
l-亮度 lightness
s-饱和 saturation
sns.palplot(sns.hls_palette(8, l=.5, s=.8))
Paired可以让相近的两个颜色成对显示
palplot
sns.palplot(sns.color_palette("Paired",8))
xkcd包含了一套针对随机RGB色的命名。产生了954个可以随时通过xdcd_rgb字典中调用的命名颜色。需要提前了解可以调用的颜色。 xkcd 包的两种调用方式如下:
plt.plot([0, 1], [0, 3], sns.xkcd_rgb["denim blue"], lw=3)
colors = ["windows blue", "amber", "greyish", "faded green", "dusty purple"]
sns.palplot(sns.xkcd_palette(colors))
连续色板
色彩随数据变换,比如数据越来越重要则颜色由浅到深?需要传入一种颜色。
颜色_r则由深到浅
sns.palplot(sns.color_palette("Blues"))  # 蓝色:由浅到深
sns.palplot(sns.color_palette("BuGn_r"))  #绿色:由深到浅
cubehelix_palette() 调色板 :色调线性变换
sns.palplot(sns.color_palette("cubehelix", 8))
sns.palplot(sns.cubehelix_palette(8, start=.5, rot=-.75))  # 8种颜色,指定颜色区间
sns.palplot(sns.cubehelix_palette(8, start=.75, rot=-.150))

light_palette() 和dark_palette()调用定制连续调色板,
reverse=True表示颜色由深到浅
sns.palplot(sns.light_palette("green"))
sns.palplot(sns.light_palette("navy", reverse=True))
sns.palplot(sns.light_palette((210, 90, 60), input="husl"))
x, y = np.random.multivariate_normal([0, 0], [[1, -.5], [-.5, 1]], size=300).T
pal = sns.dark_palette("green", as_cmap=True)  # 里层为浅色,外层为深色的颜色渐变
sns.kdeplot(x, y, cmap=pal);
单变量分析
%matplotlib inline
import numpy as np
import pandas as pd
from scipy import stats, integrate
import matplotlib.pyplot as plt

import seaborn as sns
sns.set(color_codes=True)
np.random.seed(sum(map(ord, "distributions")))

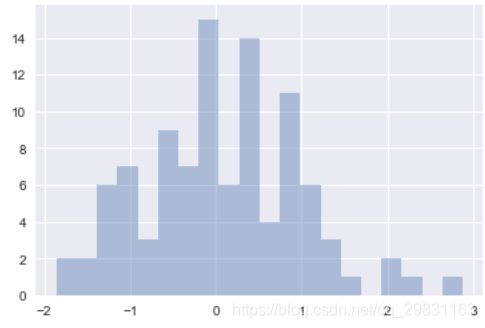
x = np.random.normal(size=100)  #  x 为要绘制的数据;distplot绘制直方图;bins为直方区间的数目
sns.distplot(x, bins=20, kde=False)  # kde核密度估计,为False表示不添加核密度曲线
数据分布情况
distplot直方图()
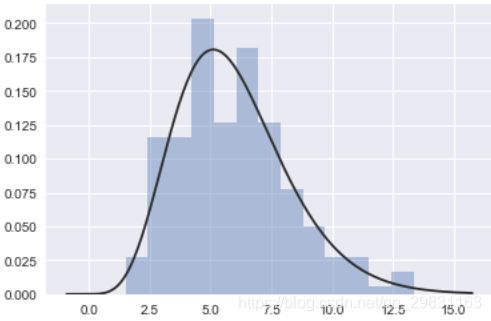
x = np.random.gamma(6, size=200)  # 产生200个服从伽马分布的数据
sns.distplot(x, kde=False, fit=stats.gamma)
mean, cov = [0, 1], [(1, .5), (.5, 1)]
data = np.random.multivariate_normal(mean, cov, 200)  # 产生多维正态分布的随机数
df = pd.DataFrame(data, columns=["x", "y"])   # 数据框
df
.jointplot() 画散点图
反映特征之间的相关关系,还会显示皮尔逊相关系数;观测两个变量之间的分布关系最好用散点图
sns.jointplot(x="x", y="y", data=df);
hex图:当数据点的数目过多时,颜色越深表示点越密集
x, y = np.random.multivariate_normal(mean, cov, 1000).T   # hex图,数据点为六角形
with sns.axes_style("white"): # 风格为黑白相间
    sns.jointplot(x=x, y=y, kind="hex", color="k")
回归分析
regplot()和lmplot()都可以绘制回归关系,入门推荐regplot() ;lmplot()功能和规范更多。
import seaborn as sns
sns.set(color_codes=True)

np.random.seed(sum(map(ord, "regression")))
tips = sns.load_dataset("tips")
tips.head()
sns.regplot(x="total_bill", y="tip", data=tips)
sns.lmplot(x="total_bill", y="tip", data=tips)
sns.regplot(x="size", y="tip", data=tips, x_jitter=.05)  # jitter 给数据加上扰动,扰动范围可自行指定
类别值的可视化展示
stripplot
import seaborn as sns
sns.set(style="whitegrid", color_codes=True)

np.random.seed(sum(map(ord, "categorical")))
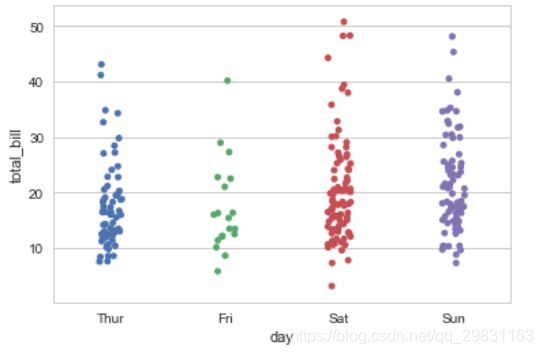
sns.stripplot(x="day", y="total_bill", data=tips);  # 重叠影响数据的观察
sns.stripplot(x="day", y="total_bill", data=tips, jitter=True) # jitter=True 使数据左右偏移
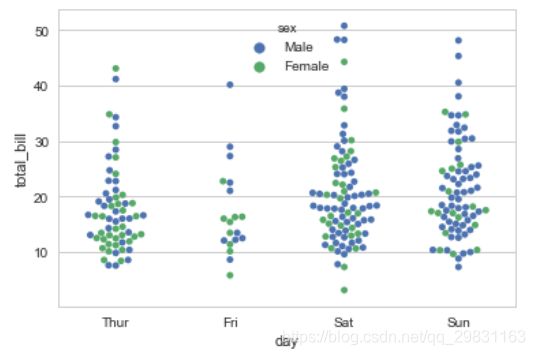
swarmplot:用于分簇散点图,避免点的重叠
sns.swarmplot(x="day", y="total_bill", data=tips)的可视化结果更像茎叶图
hue 指定划分数据的那个统计特征。调换x 和y的列名,则图像就由横向变为纵向。
sns.swarmplot(x="day", y="total_bill", hue="sex",data=tips)
sns.swarmplot(x="total_bill", y="day", hue="time", data=tips);  # 调换x 和y的列名;横着画图
小提琴图 violinplot
sns.violinplot(x="day", y="total_bill", data=tips,
            linewidth = 2,   # 线宽
            width = 0.8,     # 箱之间的间隔比例
            palette = 'hls', # 设置调色板
            order = ['Thur','Fri','Sat','Sun'],  # 筛选类别
            scale = 'area',  # 测度小提琴图的宽度:area-面积相同,count-按照样本数量决定宽度,width-宽度一样
            gridsize = 50,   # 设置小提琴图边线的平滑度,越高越平滑
            inner = 'box',   # 设置内部显示类型 → “box”, “quartile”, “point”, “stick”, None
            #bw = 0.8        # 控制拟合程度,一般可以不设置
           )

sns.violinplot(x="day", y="total_bill", hue="sex", data=tips, split=True);  # split=True表示在小提琴图的左右两边各指定属性sex的一个值
sns.violinplot(x="day", y="total_bill", data=tips, inner=None)  # inner 小提琴内部图形
sns.swarmplot(x="day", y="total_bill", data=tips, color="w", alpha=.5)  # alpha 透明度   # 插入散点图
plt.show()
sns.violinplot(x="day", y="total_bill", data=tips, inner=None)
sns.swarmplot(x="day", y="total_bill", data=tips, color="w",)
plt.show()
条形图barplot:显示数据的集中趋势
又叫柱状图,直方图;置信区间估计【置信区间:样本均值 + 抽样误差】
sns.barplot(x="sex", y="survived", hue="class", data=titanic,
            palette = 'hls',
            order = ['male','female'],  # 筛选类别
            capsize = 0.05,  # 误差线横向延伸宽度
            saturation=.8,   # 颜色饱和度
            errcolor = 'gray',errwidth = 2,  # 误差线颜色,宽度
            ci = 'sd'    # 置信区间误差 → 0-100内值、'sd'、None
            )
sns.barplot(x="sex", y="survived", hue="class", data=titanic); 显示泰坦尼克数据集上不同船舱等级【class】的男性与女性的存活率;
# 柱状图 - 置信区间估计
sns.barplot(x="day", y="total_bill", hue="sex", data=tips,
            palette = 'Blues',edgecolor = 'w')
tips.groupby(['day','sex']).mean()       # 计算数据

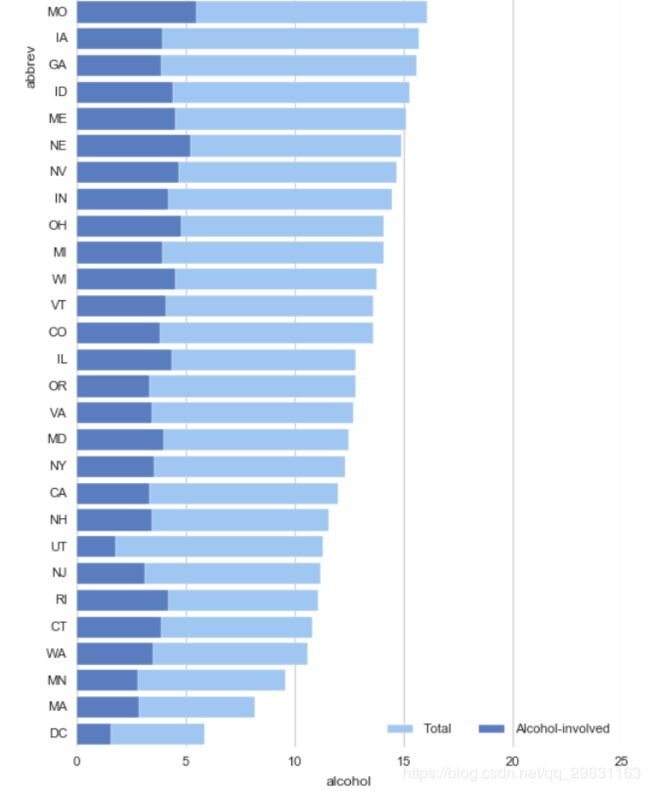
crashes = sns.load_dataset("car_crashes").sort_values("total", ascending=False)    # 加载数据
f, ax = plt.subplots(figsize=(6, 15))    # 创建图表
sns.set_color_codes("pastel")          # 设置第一个柱状图
sns.barplot(x="total", y="abbrev", data=crashes,
            label="Total", color="b",edgecolor = 'w')
sns.set_color_codes("muted")      # 设置第二个柱状图
sns.barplot(x="alcohol", y="abbrev", data=crashes,
            label="Alcohol-involved", color="b",edgecolor = 'w')
ax.legend(ncol=2, loc="lower right")
sns.despine(left=True, bottom=True)
lvplot() LV图表
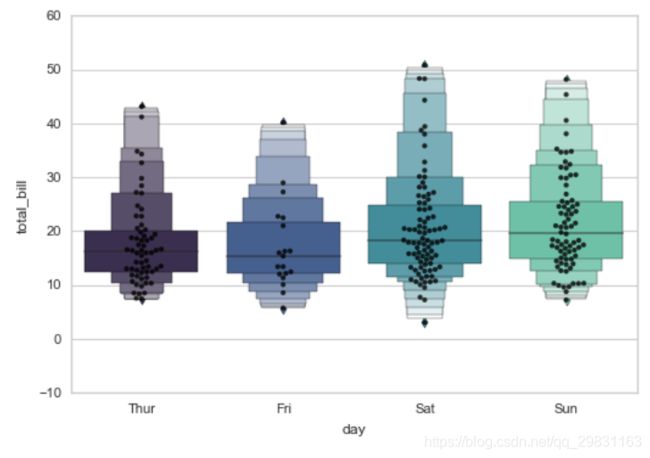
sns.lvplot(x="day", y="total_bill", data=tips, palette="mako",
           #hue = 'smoker',
           width = 0.8,           # 箱之间间隔比例
           linewidth = 12,
           scale = 'area',        # 设置框的大小 → “linear”、“exonential”、“area”
           k_depth = 'proportion',  # 设置框的数量 → “proportion”、“tukey”、“trustworthy”
          )# 绘制LV图

sns.swarmplot(x="day", y="total_bill", data=tips,color ='k',size = 3,alpha = 0.8)     # 可以添加散点图
countplot()计数柱状图
sns.countplot(x="class", hue="who", data=titanic,palette = 'magma')
#sns.countplot(y="class", hue="who", data=titanic,palette = 'magma')
# x/y → 以x或者y轴绘图(横向,竖向)
# 用法和barplot相似
pointplot折线图:更好地描述变化差异
sns.pointplot(x="sex", y="survived", hue="class", data=titanic);显示泰坦尼克数据集上不同船舱等级【class】的男性与女性的存活率的差距;
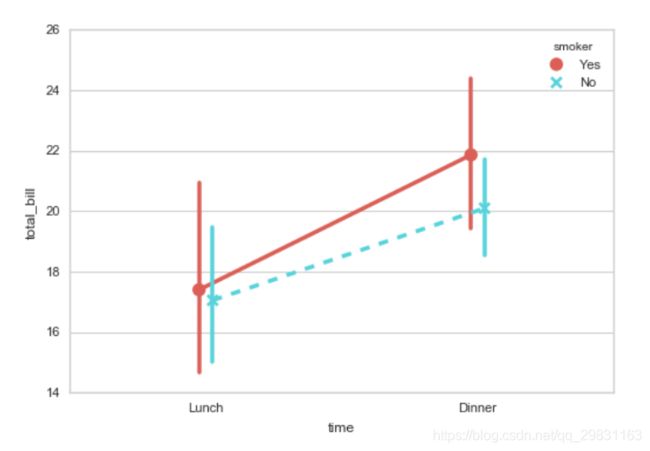
sns.pointplot(x="time", y="total_bill", hue = 'smoker',data=tips,
              palette = 'hls',                # # 用法和barplot相似
              dodge = True,   # 设置点是否分开
              join = True,    # 是否连线
              markers=["o", "x"], linestyles=["-", "--"],  # 设置点样式、线型
              )
tips.groupby(['time','smoker']).mean()['total_bill']         # 计算数据
sns.pointplot(x="class", y="survived", hue="sex", data=titanic,
              palette={"male": "g", "female": "m"},  # 颜色
              markers=["^", "o"], linestyles=["-", "--"]);  # 数据点标记为三角、圆圈,
盒图boxplot :显示数据的五数概括
怎样衡量离群点与正常值的差异,这取决于数据的特征。
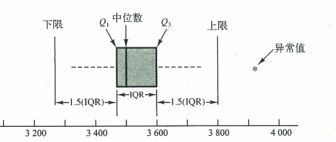
盒图又叫箱型图、箱线图;五数概括法即用下面的五个数来概括数据:
最小值min; 第1四分位数(Q1); 中位数(Q2); 第3四分位数(Q3); 最大值max
IQR即统计学中的四分位距,第一/四分位Q1与第三/四分位Q3之间的距离
一般可认为N = 1.5IQR 如果一个值大于Q3+N或 小于Q1-N,则为离群点。
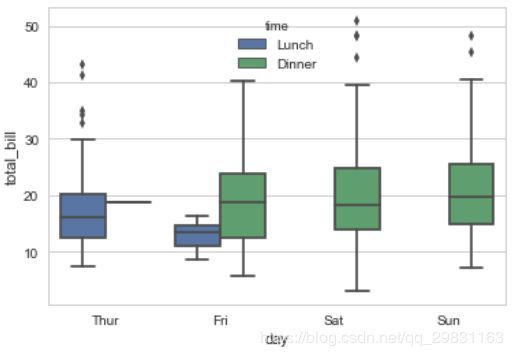
sns.boxplot(x="day", y="total_bill", data=tips,
            linewidth = 2,   # 线宽
            width = 0.8,     # 箱之间的间隔比例
            fliersize = 3,   # 异常点大小
            palette = 'hls', # 设置调色板
            whis = 1.5,      # 设置IQR
            notch = True,    # 设置是否以中值做凹槽
            order = ['Thur','Fri','Sat','Sun'],  # 筛选类别
           )  # 绘制箱型图
sns.swarmplot(x="day", y="total_bill", data=tips,color ='k',size = 3,alpha = 0.8) # 可以添加散点图
sns.boxplot(data=iris,orient="h"); # orient="h" 表示图形要横着放
factorplot :多层面板分类图
seaborn.factorplot(x=None, y=None, hue=None, data=None, row=None, col=None, col_wrap=None, estimator=, ci=95,
					n_boot=1000, units=None, order=None, hue_order=None, row_order=None, col_order=None,
					kind='point', size=4, aspect=1, orient=None, color=None, palette=None, legend=True, legend_out=True,
					sharex=True, sharey=True, margin_titles=False, facet_kws=None, **kwargs)
Parameters:
x,y,hue  数据集变量 ;变量名     hue 是分组指标
data 数据集; 数据集名
row,col 更多分类变量进行平铺显示; 变量名
col_wrap 每行的最高平铺数; 整数
estimator 在每个分类中进行矢量到标量的映射 ;矢量
ci 置信区间; 浮点数或None
n_boot 计算置信区间时使用的引导迭代次数 ;整数
units 采样单元的标识符,用于执行多级引导和重复测量设计; 数据变量或向量数据
order, hue_order 对应排序列表 ;字符串列表
row_order, col_order 对应排序列表 ;字符串列表
kind : 可选:point 默认为点图, bar 柱形图, count 频次, box 箱体, violin 提琴, strip 散点,swarm 分散点
size 每个面的高度(英寸); 标量
aspect 纵横比 ;标量
orient 方向 "v"/"h"
 color 颜色 matplotlib颜色 palette 调色板 seaborn颜色色板或字典
  legend hue的信息面板 True/False
  legend_out 是否扩展图形,并将信息框绘制在中心右边 True/False
  share{x,y} 共享轴线 True/False
示例:
sns.factorplot(x="day", y="total_bill", hue="smoker", data=tips, kind="bar")  # 条形图
sns.factorplot(x="day", y="total_bill", hue="smoker",
               col="time", data=tips, kind="swarm")      # kind="swarm" 树形图
sns.factorplot(x="time", y="total_bill", hue="smoker",
               col="day", data=tips, kind="box", size=4, aspect=.5)  # kind="box"盒图
catplot
参数解释
| data | DataFrame类型,其中每一列都是一个变量(特征),每一行都是一个样本 |
|---|---|
| x, y, hue | data中的变量名 |
| row, col, hue | strings; 定义数据子集的变量 |
| col_wrap | int;限制网格中图的列的个数; col_wrap =3则画布里最多只能画3列 |
| estimator | 可调用的将向量映射为标量的统计函数,estimate within each categorical bin |
| ci | float or “sd” or None 估计值的置信区间的大小;为sd时表示忽 bootstrapping,求观察值的标准差;为 None, n则不执行bootstrapping,不在图上加误差棒error bars |
| n_boot | int;在计算置信区间时bootstrap的迭代次数 |
| units | data 中的变量名or 向量数据 |
| order, hue_order | lists of strings;类别顺序 |
| row_order, col_order | lists of strings; 指定作图的行/列排序 |
| kind | string,图的类型;可选的有“point”, “bar”, “strip”, “swarm”, “box”, “violin”, “boxen”. |
| height | scalar;每个图片的高度设定,默认为3 |
| aspect | 纵横比;每个小图的横轴长度和纵轴的比; 默认为1,即等高等宽 |
| orient | “v” , “h”,图的放置方向 (vertical or horizontal). |
| color | matplotlib color |
| palette | 调色板; list或dict, 可选的颜色有deep, muted, bright, pastel, dark, colorblind |
| legend | bool;legend是图例;True时将hue variable的图例加到图上 |
| legend_out | bool;默认为True,图形尺寸将被扩展,并且图例将被绘制在中心右侧的图形之外 |
| share{x,y} | bool, ‘col’, or ‘row’ ;是否共享x轴或者y轴;默认是都共享True |
| margin_titles | bool;为True时,最后一列的右边会有行变量的标题 |
| facet_kws | dict;传递给FacetGrid的关键字参数 |
| kwargs | 键值对【key, value pairings】,传给绘图函数的其它关键字参数 |
| jitter | 控制抖动的大小; jitter=False 表示不对数据进行扰动 |
sns.catplot(x="smoker", y="tip", order=["No", "Yes"], data=tips); ` 使用order参数在特定图表的基础上控制排序
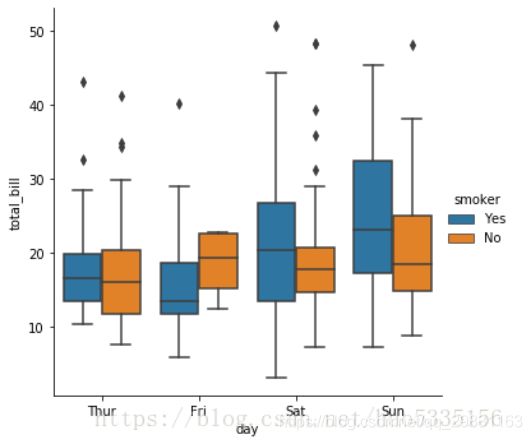
sns.catplot(x="day", y="total_bill", hue="smoker", kind="box", data=tips);添加色调变量hue
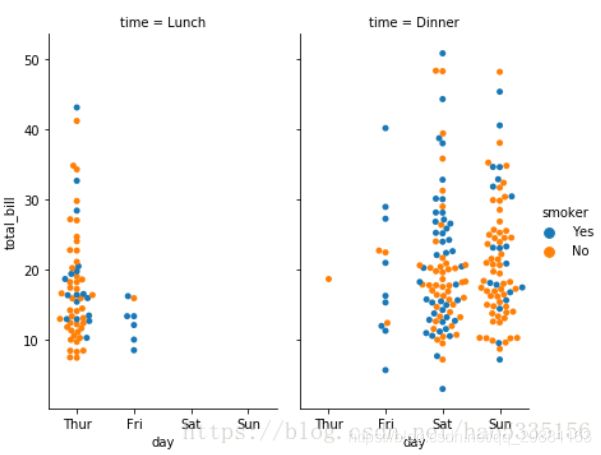
sns.catplot(x="day", y="total_bill", hue="smoker",
            col="time", aspect=.6,
            kind="swarm", data=tips);
boxenplot() : 优化版的箱线图
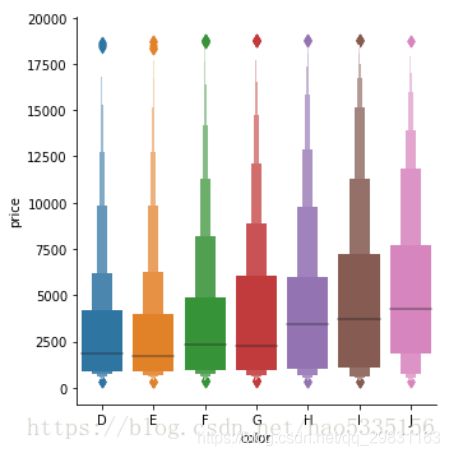
函数boxenplot() 、 参数kind=”boxen”绘制的图表类似于箱形图,但已经过优化,可显示有关分布形状的更多信息。它最适合更大的数据集。
sns.catplot(x="color", y="price", kind="boxen",
            data=diamonds.sort_values("color"));
Facetgrid
先指定属性col ,构造要可视化的区域,再用map函数作图;要求数据格式为pandas中的格式。
在大多数情况下,使用图形级别功能(如relplot()或catplot())比 FacetGrid直接使用更好。
class seaborn.FacetGrid(data, row=None, col=None, hue=None, col_wrap=None, sharex=True, sharey=True,
						height=3, aspect=1, palette=None, row_order=None, col_order=None, hue_order=None,
						hue_kws=None, dropna=True, legend_out=True, despine=True, margin_titles=False, xlim=None,
						ylim=None, subplot_kws=None, gridspec_kws=None, size=None)
参数解释
| data | DataFrame类型,其中每一列都是一个变量(特征),每一行都是一个样本 |
|---|---|
| row, col, hue | strings; 定义数据子集的变量 |
| col_wrap | int;限制网格中图的列的个数; col_wrap =3则画布里最多只能画3列 |
| orient | “v” , “h”,图的放置方向 (vertical or horizontal). |
| share{x,y} | bool, ‘col’, or ‘row’ ;是否共享x轴或者y轴;默认是都共享True |
| height | scalar;每个图片的高度设定,默认为3 |
| aspect | 纵横比;每个小图的横轴长度和纵轴的比; 默认为1,即等高等宽 |
| palette | list或dict, 可选的颜色有deep, muted, bright, pastel, dark, colorblind |
| {row,col,hue}_order | lists;指定排序;默认是数据中显示的级别,如果变量是pandas分类,则是类别顺序。 |
| hue_kws | dictionary of param -> list of values mapping;hue_kwss增加快速辨识,在变量很多时很有用 |
| legend_out | bool;legend是图例;默认为True,图形尺寸将被扩展,并且图例将被绘制在中心右侧的图形之外 |
| despine | boolean;从图中移除顶部和右侧边框, 边缘框架 |
| margin_titles | bool;为True时,最后一列的右边会有行变量的标题 |
| {x, y}lim | tuples;每条轴的数值区间 |
| subplot_kws | dict,传递给matplotlib的subplot(s) 方法的关键字参数字典 ;可参考subplot函数的参数 |
| gridspec_kws | dict, 传递给matplotlib的gridspec模块的关键字参数的字典 |
g = sns.FacetGrid(tips, col="sex", hue="time", palette=pal,hue_order=["Dinner", "Lunch"],
hue_kws=dict(marker=["^", "v"])) # 给颜色语意使用不同的标签,这样可以进行一部分区别
g = (g.map(plt.scatter, "total_bill", "tip", **kws).add_legend())
tips = sns.load_dataset("tips")
g = sns.FacetGrid(tips, col="time")  # 这一步只显示作图区域
g.map(plt.hist, "tip");
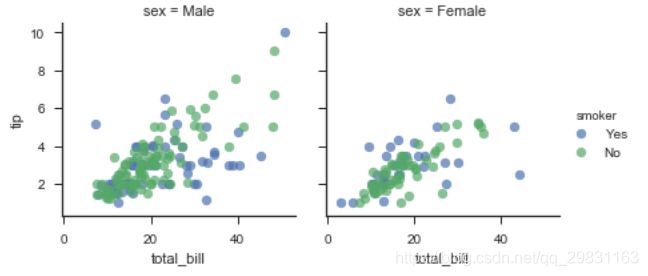
g = sns.FacetGrid(tips, col="sex", hue="smoker")
g.map(plt.scatter, "total_bill", "tip", alpha=.7)  # 散点图 ;alpha 为散点图的透明度,值越小越透明
g.add_legend();   # 添加类别注释/ 图例
g = sns.FacetGrid(tips, row="smoker", col="time", margin_titles=True)
g.map(sns.regplot, "size", "total_bill", color=".1", fit_reg=False, x_jitter=.1);  # fit_reg 是否添加回归线 ;color颜色深浅
整体布局的设置
g = sns.FacetGrid(tips, col="day", size=4, aspect=.5)  #  size 图像大小;aspect设置图的长宽比
g.map(sns.barplot, "sex", "total_bill");
指定画图的顺序
自行指定顺序,则要用pandas中的Categorical ,
from pandas import Categorical
ordered_days = Categorical(['Thur', 'Fri', 'Sat', 'Sun'])  # 指定顺序
g = sns.FacetGrid(tips, row="day", row_order=ordered_days,
                  size=1.7, aspect=4,)
g.map(sns.boxplot, "total_bill");
pal = dict(Lunch="seagreen", Dinner="gray") # 用字典dict 指定颜色
g = sns.FacetGrid(tips, hue="time", palette=pal, size=5) # palette 指定调色板
g.map(plt.scatter, "total_bill", "tip", s=50, alpha=.7, linewidth=.5, edgecolor="white") # edgecolor边界颜色  ;s是数据点圆圈的大小
g.add_legend();
marker 指定数据点的形状
g = sns.FacetGrid(tips, hue="sex", palette="Set1", size=5, hue_kws={"marker": ["^", "v"]})  # marker 数据点的形状
g.map(plt.scatter, "total_bill", "tip", s=100, linewidth=.5, edgecolor="white")
g.add_legend();
绘制子图
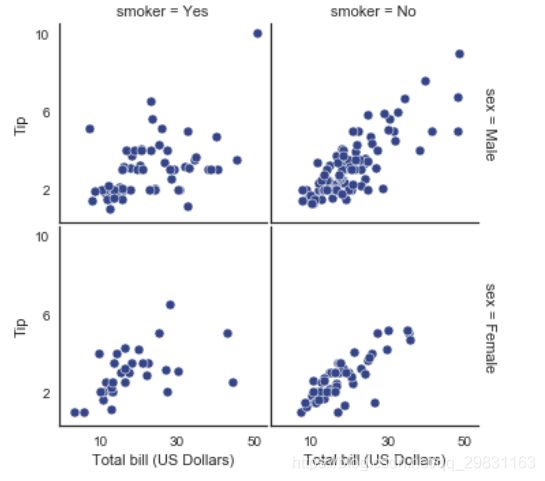
with sns.axes_style("white"):  # 用with;  axes_style设置风格
    g = sns.FacetGrid(tips, row="sex", col="smoker", margin_titles=True, size=2.5)
g.map(plt.scatter, "total_bill", "tip", color="#334488", edgecolor="white", lw=.5);
g.set_axis_labels("Total bill (US Dollars)", "Tip"); # 显示x轴、y轴的名称
g.set(xticks=[10, 30, 50], yticks=[2, 6, 10]); # xticks 显示X轴上的刻度值;用set设置刻度
g.fig.subplots_adjust(wspace=.02, hspace=.02);  # 设置子图的间距;
#g.fig.subplots_adjust(left  = 0.125,right = 0.5,bottom = 0.1,top = 0.9, wspace=.02, hspace=.02)  # 调偏移程度
PairGrid :画对图
相关图又称散点图或散布图。
iris = sns.load_dataset("iris")
g = sns.PairGrid(iris) # 画成对的图,显示任意两个变量之间的相关关系图,
g.map_diag(plt.hist) # 指定对角线上画直方图
g.map_offdiag(plt.scatter);  # 非对角线上画 散点图
g = sns.PairGrid(iris, hue="species") # 添加区分的类别为物种
g.map_diag(plt.hist)
g.map_offdiag(plt.scatter)
g.add_legend();
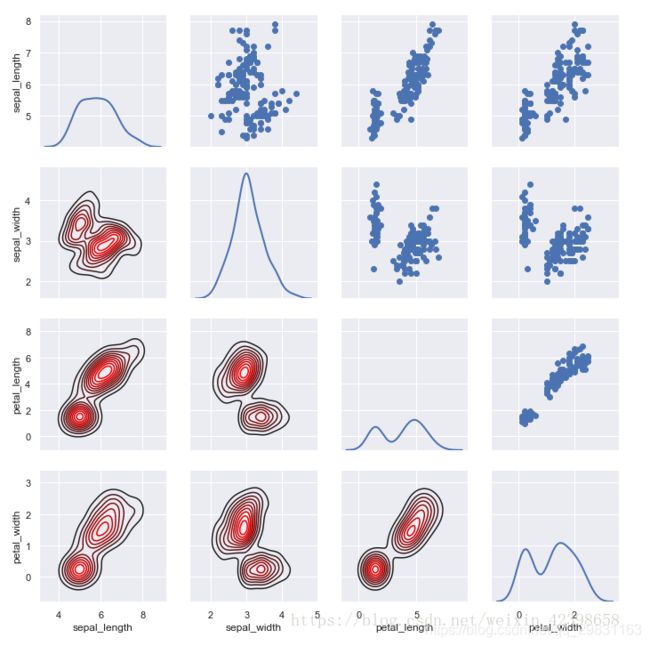
也可以在上三角和下三角中使用不同的函数来强调关系的不同方面。
g = sns.PairGrid(iris)
g.map_upper(plt.scatter)
g.map_lower(sns.kdeplot,color='red')
g.map_diag(sns.kdeplot, lw=2, legend=False);
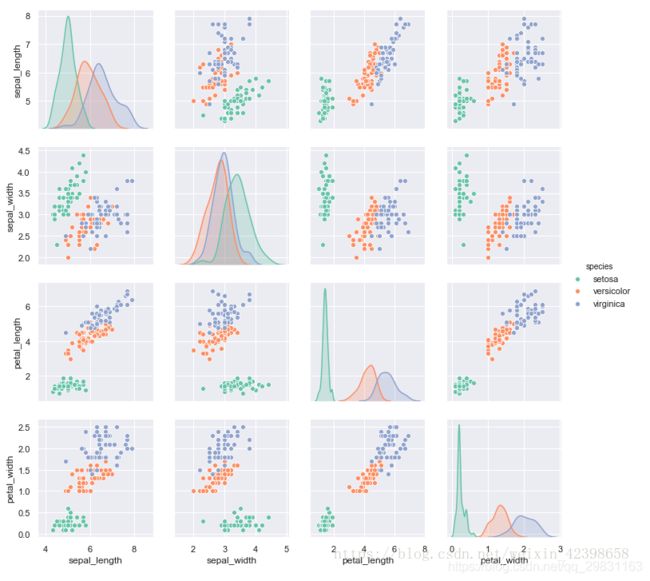
PairGrid很灵活,但要快速查看数据集,使用pairplot()可以更容易。此功能默认使用散点图和直方图,但会添加一些其他类型(对角线上的回归图和对角线上的核密度估计KDE)。
.pairplot绘制两两变量之间的关系;对角线上是直方图【单变量】,其它是散点图。
g = sns.pairplot(iris, hue="species", palette="Set2", diag_kind="kde", height=2.5)
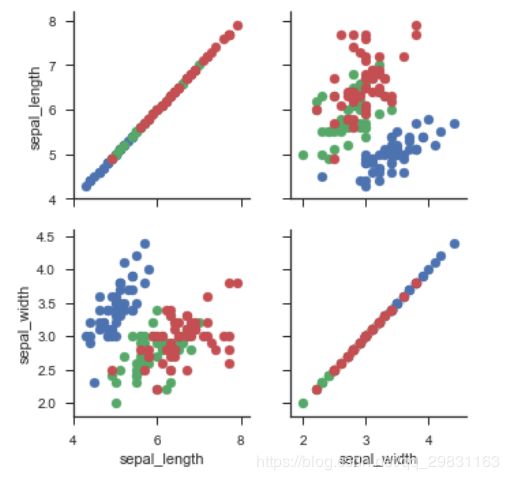
vars指定画图的特征子集
g = sns.PairGrid(iris, vars=["sepal_length", "sepal_width"], hue="species")
g.map(plt.scatter);
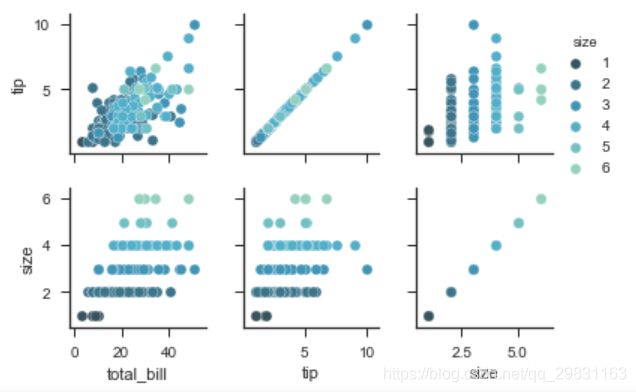
g = sns.PairGrid(tips, hue="size", palette="GnBu_d")  # 分类指标为size,有6个取值
g.map(plt.scatter, s=50, edgecolor="white")
g.add_legend();`
heatmap :热力图、热度图
heatmap用颜色的深浅、亮度等来显示数据的分布,还常用于可视化特征间的相关系数。用颜色深浅来反映相关程度。
%matplotlib inline
import matplotlib.pyplot as plt
import numpy as np;
np.random.seed(0)
import seaborn as sns;
sns.set()

uniform_data = np.random.rand(3, 3)
print (uniform_data)
heatmap = sns.heatmap(uniform_data)   # 最右边的是color bar

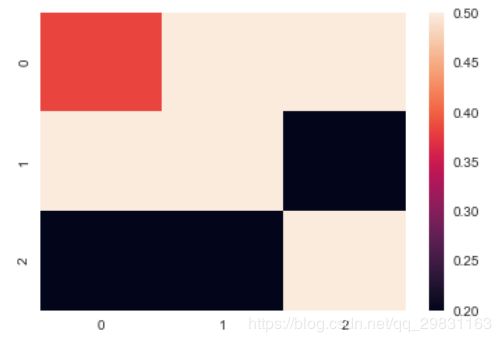
vmaxax = sns.heatmap(uniform_data, vmin=0.2, vmax=0.5) 取值低于vmin的是一种颜色,高于vmax的是另一种颜色,
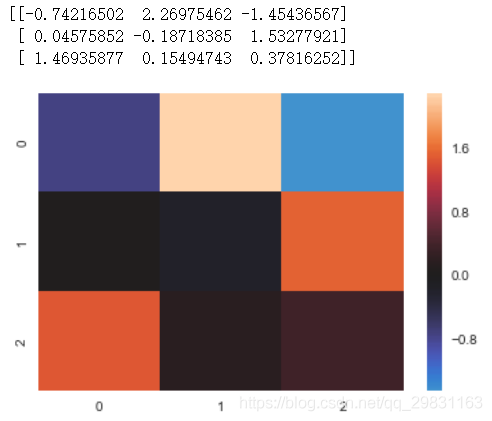
center=0指定中心值,大于或小于零的值对应的颜色不一样。
normal_data = np.random.randn(3, 3)
print (normal_data)
ax = sns.heatmap(normal_data, center=0)   #  例如股票数据的收益率大于0表示涨,小于零表示跌
| heatmap参数注释 | |
|---|---|
| annot | bool ;为True表示增加注释,把值加到对应位置去 |
| fmt | 数值的格式,fmt默认为科学计数法,作图容易乱码 |
| cmap | 可调用的调色板 |
| linewidths | 格子的间距,更容易清晰地看出数值的差距 |
| cbar | color bar , 取False则不显示cbar |
flights = sns.load_dataset("flights")
flights = flights.pivot("month", "year", "passengers")  # pivot数据透视表,
# ax = sns.heatmap(flights)     # fmt="d"表示数值的格式,#cmap 指定数据值到颜色空间的映射;
ax = sns.heatmap(flights, annot=True,fmt="d", cmap="YlGnBu",linewidths=.5, cbar=True)
绘制半边热图
#设置风格
sns.set(style = 'white')
#创建数据
rs = np.random.RandomState(33)
d = pd.DataFrame(rs.normal(size = (100, 26)))
corr = d.corr()  #求解相关性矩阵表格
mask = np.zeros_like(corr, dtype = np.bool)     #设置一个‘上三角形’蒙版
mask[np.triu_indices_from(mask)] = True
#设置调色盘
cmap = sns.diverging_palette(220, 10, as_cmap = True)
#生成半边热图
sns.heatmap(corr, mask = mask, cmap = cmap, vmax = .3, center = 0,
            square = True, linewidths = 0.2)
【参考链接】
Python图表数据可视化Seaborn:2. 分类数据可视化-分类散点图|分布图(箱型图|小提琴图|LV图表)|统计图(柱状图|折线图)
多变量的分布绘图:stripplot()、swarmplot();箱线图与小提琴图;条形图;点图;多层面板分类图:catplot函数、FacetGrid 类、PairGrid类;热力图
seaborn教程——用分类数据绘图
Seaborn学习(一)------- 构建结构化多绘图网格(FacetGrid()、map())详解

