Python科学绘图实例附代码
Python绘图精简实例附代码
作者:金良([email protected]) csdn博客:http://blog.csdn.net/u012176591
- Python绘图精简实例附代码
- 引自知乎如何在论文中画出漂亮的插图
- 正态曲线图
- 云模型示意图
- scatter-hist图
- 若干类型的图例
- 热图
- 为点加标签
- 导入已有图片并进行修饰
- 热度方格图
- 箱线图
- 双纵坐标
- legend不在一块
- legend放一块儿
- 多个子图共用一个legend
1.引自知乎:如何在论文中画出漂亮的插图
这个例子源于我在知乎上看到的一个名为《如何在论文中画出漂亮的插图》的话题(网址为http://www.zhihu.com/question/21664179),这个例子让我对Python绘制插图的能力感到震撼,于是我研摩了该例子的源码并对其不足做了一些修正。
首先看插图,吃精了吧
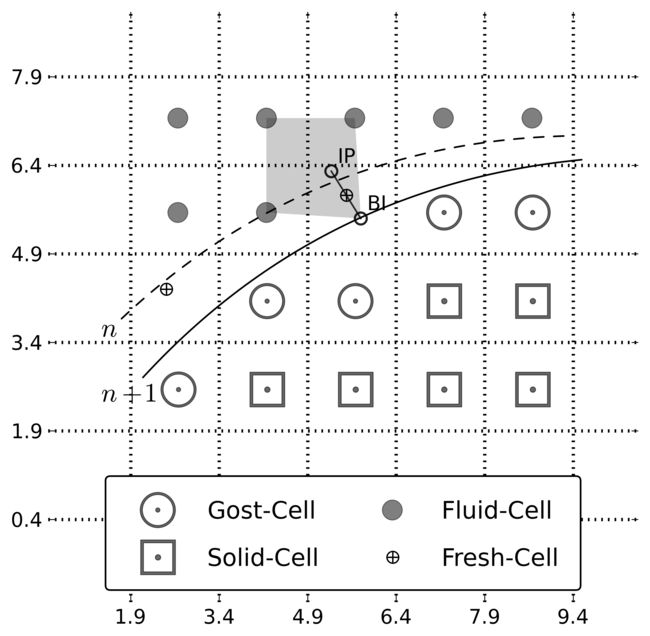
还有源码,我加了详细的注释,应该不难理解
import matplotlib.pyplot as plt
import numpy as np

# 空心框
boxcell_x = np.concatenate([np.arange(0,4)*1.5+4.2, np.arange(0,2)*1.5+7.2])#np.array([])
boxcell_y = np.concatenate([np.ones(4)*2.6, np.ones(2)*4.1])

#空心圆圈
circell_x = np.array([2.7, 4.2, 5.7, 7.2, 8.7])
circell_y = np.array([2.6, 4.1, 4.1, 5.6, 5.6])

#实心灰色圆
dotcell_x = np.array([2.7, 4.2, 2.7, 4.2, 5.7, 7.2, 8.7])
dotcell_y = np.array([5.6, 5.6, 7.2, 7.2, 7.2, 7.2, 7.2])

#阴影区
shodow_x = np.array([4.2, 4.2, 5.7, 5.8])
shodow_y = np.array([5.6, 7.2, 7.2, 5.5])

#带加号的小型圈
crosscell_x = np.array([2.5, 5.55])
crosscell_y = np.array([4.3, 5.89])

#不带加号的小型圈
sdotcell_x = np.array([5.3, 5.8])
sdotcell_y = np.array([6.3, 5.5])

# plot marks
#空心圆圈,alpha参数是透明度,一共5个
plt.plot(circell_x,circell_y, marker=r'$\bigodot$', markersize=22,
        linewidth=0, alpha=0.6, color='k', label='Gost-Cell')

# 空心框,一共6个
plt.plot(boxcell_x,boxcell_y, marker=r'$\boxdot$', markersize=22,
        linewidth=0, alpha=0.6, color='k', label='Solid-Cell')

#实心灰色圆,一共7个
plt.plot(dotcell_x,dotcell_y, marker=r'$\bullet$', markersize=12, linewidth=0,
        alpha=0.5, color='k', label='Fluid-Cell')

#带加号的小型圈,两个
plt.plot(crosscell_x,crosscell_y, marker=r'$\oplus$', markersize=8,
        linewidth=0, label='Fresh-Cell')

#不带加号的小型圈,两个
plt.plot(sdotcell_x,sdotcell_y, marker=r'$\circ$', markersize=8,
        linewidth=1, alpha=0.8, color='k')

# plot shodow,一处
plt.fill(shodow_x, shodow_y, linewidth=0, alpha=0.2, color='k')

# textcoords属性设置为'offset points',表示以xytext是以xy为起点的偏移量,偏移量是像素点,呵呵。
plt.annotate('BI', xy=(5.8, 5.5), xytext=(+5, +5), textcoords='offset points')
plt.annotate('IP', xy=(5.3, 6.3), xytext=(+5, +5), textcoords='offset points')

# plot curve
# connectionstyle表示曲线的弯曲程度;arrowstyle表示箭头的风格,这里实际上用的是虚线;xycoords和textcoords指示xy和xytext的位置关系
# 二者的参数是字符串'data',表示使用被注释对象的坐标系统,也就是通常说的坐标。
plt.annotate(r'$n+1$',
         xy=(9.6, 6.5), xycoords='data',
         xytext=(1.4, 2.4), textcoords='data', fontsize=16,
         arrowprops=dict(arrowstyle="-", connectionstyle="arc3,rad=-.2"))
plt.annotate(r'$n$',
         xy=(9.4, 6.9), xycoords='data',
         xytext=(1.4, 3.5), textcoords='data', fontsize=16,
         arrowprops=dict(arrowstyle="-", connectionstyle="arc3,rad=-.2",
             linestyle='dashed'))
plt.grid(True, color='k', linewidth=2)

# set the figure style
ax = plt.gca()

#规定坐标轴的刻度
ax.set_xticks(np.arange(0,10,1.5)+0.4)
ax.set_yticks(np.arange(0,10,1.5)+0.4)

#设置周边的坐标轴的颜色为空白,如果不设置,图片四周就会有黑色的坐标线。
ax.spines['right'].set_color('none')
ax.spines['bottom'].set_color('none')
ax.spines['left'].set_color('none')
ax.spines['top'].set_color('none')

#调整图框的尺寸(而不是改变坐标轴取值范围),使x、y 轴长度一致
plt.axis('scaled')#没有此项,则图形为长方形

#下面连个参数规定了最终生成的图片的坐标范围
plt.xlim(0.5,10.5)
plt.ylim(-1,9)

#控制各个轴线是否显示刻度标签
#plt.tick_params(labelbottom='off', labelleft='off', left='off', right='off',bottom='off', top='off')

# add the legend
#numberpoints是标签中点的个数设置,用scatterpoints不起作用;ncol表示每行有两个标签;handlelength图例中xiant线条长度;
#handletextpad线条和文字间距;labelspacingtu图例的行距;fancybox图例边框是否花边。
ax.legend(loc='lower center',numpoints=1, handlelength=2.3, handletextpad=1, labelspacing=1,
        ncol=2,mode="None",borderpad=1, fancybox=True)

plt.savefig('myfig.png',dpi=400,bbox_inches='tight')
plt.show()
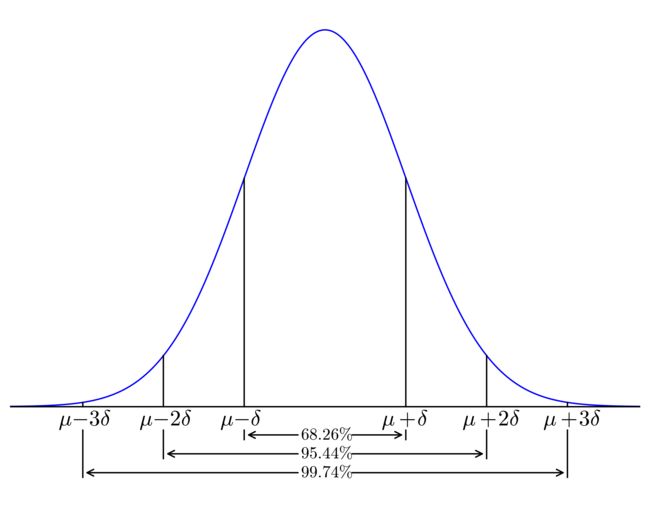
2.正态曲线图
代码:
from scipy.stats import norm
normobj = norm()
x = np.arange(-4,4,0.01)
y = normobj.pdf(x)#正态曲线的概率密度函数

plot(x,y)
plot([-1,-1],[0,normobj.pdf(-1)],'k')#作一条直线
plot([1,1],[0,normobj.pdf(1)],'k')

plot([-2,-2],[0,normobj.pdf(-2)],'k')
plot([2,2],[0,normobj.pdf(2)],'k')

plot([-3,-3],[0,normobj.pdf(-3)],'k')
plot([3,3],[0,normobj.pdf(3)],'k')

plot([-3.9,3.9],[0,0],'k')

xlim(-3.9,3.9)
ylim(-0.1,0.42)

#写字符串,前两个参数分别是横坐标和纵坐标,是字符串的起始点而不是中点。
text(-1-0.3, -0.02, u'$\mu-\delta$', fontsize=16)
text(1-0.3, -0.02, u'$\mu+\delta$', fontsize=16)
text(-2-0.3, -0.02, u'$\mu-2\delta$', fontsize=16)
text(2-0.3, -0.02, u'$\mu+2\delta$', fontsize=16)
text(-3-0.3, -0.02, u'$\mu-3\delta$', fontsize=16)
text(3-0.3, -0.02, u'$\mu+3\delta$', fontsize=16)

plot([-1,-1],[-0.025,-0.035],'k')
plot([1,1],[-0.025,-0.035],'k')

plot([-2,-2],[-0.025,-0.055],'k')
plot([2,2],[-0.025,-0.055],'k')

plot([-3,-3],[-0.025,-0.075],'k')
plot([3,3],[-0.025,-0.075],'k')

text(-0.3, -0.035, u'$68.26\%$', fontsize=12)
text(-0.3, -0.055, u'$95.44\%$', fontsize=12)
text(-0.3, -0.075, u'$99.74\%$', fontsize=12)

#作箭头,第一个参数为空,表示交投不带标注,参数xy为箭头坐标,xytext为箭尾坐标。
annotate('',xy=(-1,-0.03),xytext=(-0.3,-0.03),arrowprops=dict(arrowstyle="->",connectionstyle="arc3"))
annotate('',xy=(1,-0.03),xytext=(0.3,-0.03),arrowprops=dict(arrowstyle="->",connectionstyle="arc3"))

annotate('',xy=(-2,-0.05),xytext=(-0.3,-0.05),arrowprops=dict(arrowstyle="->",connectionstyle="arc3"))
annotate('',xy=(2,-0.05),xytext=(0.3,-0.05),arrowprops=dict(arrowstyle="->",connectionstyle="arc3"))

annotate('',xy=(-3,-0.07),xytext=(-0.3,-0.07),arrowprops=dict(arrowstyle="->",connectionstyle="arc3"))
annotate('',xy=(3,-0.07),xytext=(0.3,-0.07),arrowprops=dict(arrowstyle="->",connectionstyle="arc3"))

#不要坐标轴
tick_params(labelbottom='off', labelleft='off', left='off', right='off',bottom='off', top='off')

#使边框不显示
ax = plt.gca()
ax.spines['right'].set_color('none')
ax.spines['bottom'].set_color('none')
ax.spines['left'].set_color('none')
ax.spines['top'].set_color('none')
savefig('norm.png',dpi=400,bbox_inches='tight')
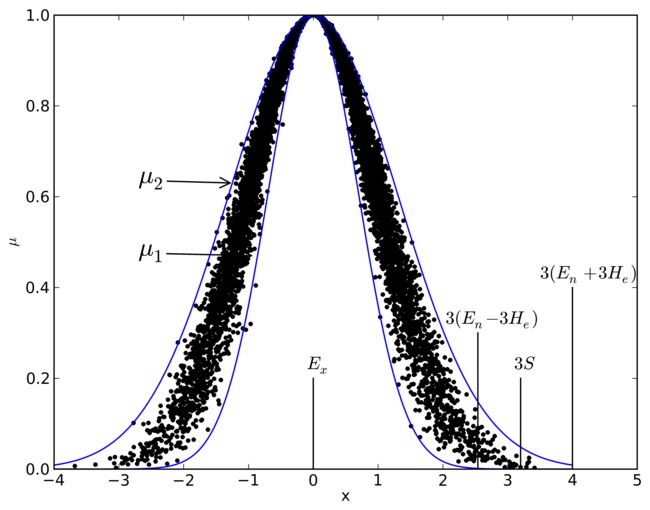
3.云模型示意图
import numpy as np
import matplotlib.pyplot as plt
%pylab
import random
def backcloud(cloudpara,n=1000):
    Ex = cloudpara[0]
    En = cloudpara[1]
    He = cloudpara[2]

    xd = []
    yd = []

    for i in range(n):
        Enn = random.gauss(0,1)*He + En
        x = random.gauss(0,1)*Enn + Ex
        y = np.exp(-(x-Ex)**2/(2*Enn**2))
        xd.append(x)
        yd.append(y)

    return xd,yd

def expcurve(myex=0,mydelta=1,myshift=4):
    x = np.arange(-myshift,myshift,0.01)
    y = np.exp(-0.5*(x-myex)**2/mydelta**2)
    return x,y

x,y = backcloud((0,1,0.1),3000)
plot(x,y,'.k')
x,y = expcurve(0,1.3,4)
plot(x,y,'b')
x,y = expcurve(0,0.7,4)
plot(x,y,'b')
annotate(u'$\mu_2$',xy=(-1.22,0.63),xytext=(-2.7,0.63),arrowprops=dict(arrowstyle="->",connectionstyle="arc3"),fontsize=20)
annotate(u'$\mu_1$',xy=(-0.889,0.47),xytext=(-2.7,0.47),arrowprops=dict(arrowstyle="->",connectionstyle="arc3"),fontsize=20)

plot([4,4],[0,0.4],'k')
plot([3.2,3.2],[0,0.2],'k')
plot([2.54,2.54],[0,0.3],'k')
plot([0,0],[0,0.2],'k')

text(4-0.5, 0.42, u'$3(E_n+3H_e)$', fontsize=14)
text(2.54-0.5, 0.32, u'$3(E_n-3H_e)$', fontsize=14)
text(3.2-0.1, 0.22, u'$3S$', fontsize=14)
text(0-0.1, 0.22, u'$E_x$', fontsize=14)

xlim(-4,5)
ax = plt.gca()
xlabel('x')
ylabel(u'$\mu$')
savefig('cloudmodelfeature.png',dpi=700,bbox_inches='tight')
4. scatter-hist图
import numpy as np
import matplotlib.pyplot as plt
from matplotlib.ticker import NullFormatter

# the random data
x = np.random.randn(3000)
y = np.random.randn(3000)

nullfmt   = NullFormatter()         # no labels

# definitions for the axes
left, width = 0.1, 0.65
bottom, height = 0.1, 0.65
bottom_h = left_h = left+width+0.02

#左下角较大的区域,参数为画布的比例
rect_scatter = [left, bottom, width, height]
#上面的条形图区域
rect_histx = [left, bottom_h, width, 0.2]
#右边的条形图区域
rect_histy = [left_h, bottom, 0.2, height]

# figsize参数是以inch为单位,在桌面上显示的画布的大小
plt.figure(1, figsize=(8,8))

axScatter = plt.axes(rect_scatter)
axHistx = plt.axes(rect_histx)
axHisty = plt.axes(rect_histy)

# no labels
#axHistx的x坐标无刻度
axHistx.xaxis.set_major_formatter(nullfmt)
#axHisty的y坐标无刻度
axHisty.yaxis.set_major_formatter(nullfmt)

# the scatter plot:
#画散点图
axScatter.scatter(x, y)

# now determine nice limits by hand:
binwidth = 0.25
xymax = np.max( [np.max(np.fabs(x)), np.max(np.fabs(y))] )
lim = xymax+0.1#( int(xymax/binwidth) + 1) * binwidth

axScatter.set_xlim( (-lim, lim) )
axScatter.set_ylim( (-lim, lim) )

bins = np.arange(-lim, lim + binwidth, binwidth)
axHistx.hist(x, bins=bins)
axHisty.hist(y, bins=bins, orientation='horizontal')

axHistx.set_xlim( axScatter.get_xlim() )
axHistx.set_yticklabels(labels=['0','50','100','150','200','250','300','350'],rotation=47)

axHisty.set_ylim( axScatter.get_ylim() )
axHisty.set_xticklabels(labels=['0','50','100','150','200','250','300','350'],rotation=-47)

#plt.show()
savefig('scatter-hist.png',dpi=700,bbox_inches='tight')
5.若干类型的图例
- Matplotlib tutorial
http://www.labri.fr/perso/nrougier/teaching/matplotlib/
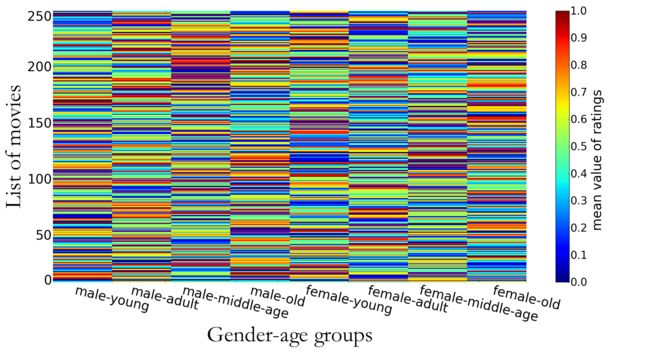
6.热图
import matplotlib.pyplot as plt
import numpy as np

def f(x,y):
    return (1-x/2+x**5+y**3)*np.exp(-x**2-y**2)+5


xx,yy = np.meshgrid(np.linspace(-3,3,50),np.linspace(-3,3,50))
zz = f(xx,yy)
plt.imshow(zz,origin='lower',extent=[xx.min(), xx.max(), yy.min(), yy.max()])
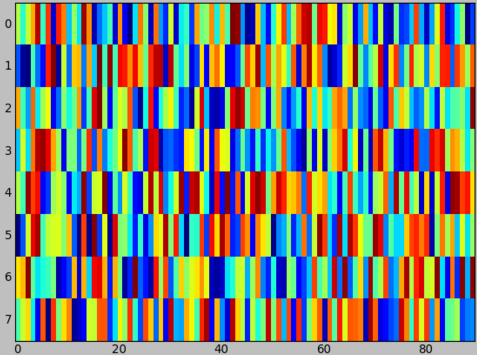
If you don’t need an equal aspect you can set aspect to auto :
imshow(random.rand(8, 90), interpolation='nearest', aspect='auto')data2show = np.random.random((242, 8))
fig, ax= plt.subplots()
plt.imshow(data2show,interpolation='nearest', aspect='auto')
cb = plt.colorbar()
cb.ax.tick_params(labelsize=25)
cb.set_label(r'mean value of ratings', labelpad=10, y=0.45) #colorbar的标签和位置
text = cb.ax.yaxis.label
font = matplotlib.font_manager.FontProperties(size=30)
text.set_font_properties(font)
plt.yticks([5,50,100,150,200,240],[250,200,150,100,50,0],fontsize = 30)
plt.xticks([0.5,1.4,2.59,3.3,4.5,5.5,6.7,7.5],['male-young','male-adult','male-middle-age','male-old','female-young','female-adult',
'female-middle-age','female-old'],fontsize = 30,rotation=-13)
plt.xlabel('Gender-age groups',{'fontname':'STFangsong','fontsize':52})
plt.ylabel('List of movies',{'fontname':'STFangsong','fontsize':52})
ax.spines['right'].set_color('none')
ax.spines['bottom'].set_color('none')
ax.spines['left'].set_color('none')
ax.spines['top'].set_color('none')7.为点加标签
import numpy as np
import matplotlib.pyplot as plt

N = 10
data = np.random.random((N, 4))
labels = ['point{0}'.format(i) for i in range(N)]
plt.subplots_adjust(bottom = 0.1)
plt.scatter(
    data[:, 0], data[:, 1], marker = 'o', c = data[:, 2], s = data[:, 3]*1500,
    cmap = plt.get_cmap('Spectral'))
for label, x, y in zip(labels, data[:, 0], data[:, 1]):
    plt.annotate(
        label,
        xy = (x, y), xytext = (-20, 20),
        textcoords = 'offset points', ha = 'right', va = 'bottom',
        bbox = dict(boxstyle = 'round,pad=0.5', fc = 'yellow', alpha = 0.5),
        arrowprops = dict(arrowstyle = '->', connectionstyle = 'arc3,rad=0'))

plt.show()
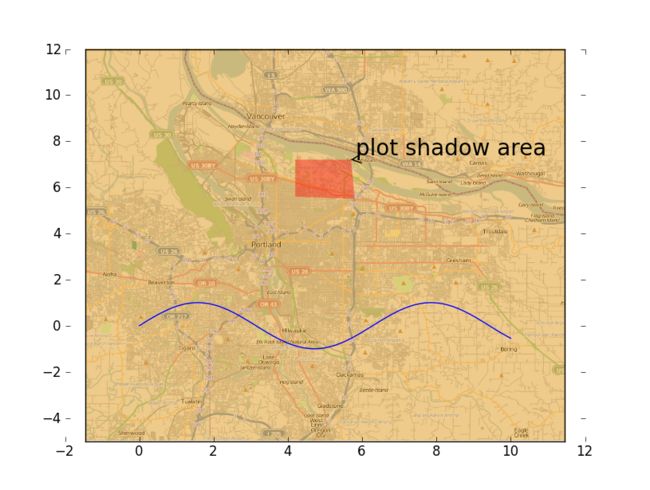
8.导入已有图片并进行修饰
fig = plt.figure()
rect=[0.1,0.1,0.8,0.8]
axprops = dict(xticks=[], yticks=[])

ax0=fig.add_axes(rect, label='ax0',**axprops)
imgP = plt.imread('Portland.png')
ax0.imshow(imgP)

ax1=fig.add_axes(rect, label='ax1',frameon=False)
x = linspace(0,10,100)
y = sin(x)
ax1.plot(x,y)
ax1.set_xlim([-2,12])
ax1.set_ylim([-5,12])


ax2=fig.add_axes(rect, label='ax2',frameon=False,**axprops)
shodow_x = np.array([4.2, 4.2, 5.7, 5.8])
shodow_y = np.array([5.6, 7.2, 7.2, 5.5])
ax2.set_xlim([-2,12])
ax2.set_ylim([-5,12])
ax2.fill(shodow_x, shodow_y, linewidth=0, alpha=0.4, color='r')
ax2.annotate('plot shadow area',xy=(5.7,7.2),xytext=(4.7,3.3),textcoords = 'offset points',arrowprops=dict(arrowstyle="->",connectionstyle="arc3"),fontsize=20)


plt.show()
9.热度方格图
data = np.array([[ 0.45833279,  0.35737994,  0.54257486,  0.66908835],
                 [ 0.19544843,  0.48287855,  0.97316904,  0.25445816],
                 [ 0.44500619,  0.88060579,  0.74509425,  0.65703952],
                 [ 0.80474809,  0.48011234,  0.05086501,  0.47188907]])
fig, ax = plt.subplots()
heatmap = ax.pcolor(data, cmap=plt.cm.Greys)

# put the major ticks at the middle of each cell
ax.set_xticks(np.arange(data.shape[0])+0.5, minor=False)
ax.set_yticks(np.arange(data.shape[1])+0.5, minor=False)

# want a more natural, table-like display
ax.invert_yaxis()
ax.xaxis.tick_top()

ax.set_xticklabels(['a','b','c','d'], minor=False)
ax.set_yticklabels(['A','B','C','D'], minor=False)

cbar = plt.colorbar(heatmap)
10. 箱线图
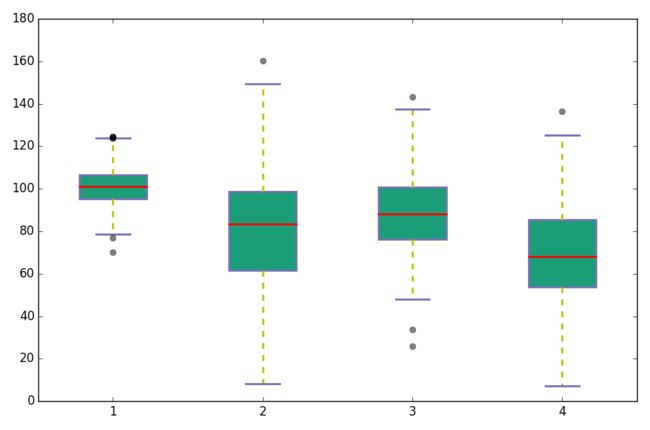
np.random.seed(10)
data_to_plot = [np.random.normal(100, 10, 200),
                np.random.normal(80, 30, 200),
                np.random.normal(90, 20, 200),
                np.random.normal(70, 25, 200)]

fig = plt.figure(1, figsize=(9, 6))
# Create an axes instance
ax = fig.add_subplot(111)

## add patch_artist=True option to ax.boxplot()
## to get fill color
bp = ax.boxplot(data_to_plot, patch_artist=True)

## change outline color, fill color and linewidth of the boxes
for box in bp['boxes']:
    # change outline color
    box.set( color='#7570b3', linewidth=2)
    # change fill color
    box.set( facecolor = '#1b9e77' )

## change color and linewidth of the whiskers
for whisker in bp['whiskers']:
    whisker.set(color='y', linewidth=2)

## change color and linewidth of the caps
for cap in bp['caps']: # 上下的帽子
    cap.set(color='#7570b3', linewidth=2)

## change color and linewidth of the medians
for median in bp['medians']: #中值
    median.set(color='r', linewidth=2)

## change the style of fliers and their fill
for flier in bp['fliers']: #异常值
    flier.set(marker='o', color='k', alpha=0.5)
双纵坐标
legend不在一块
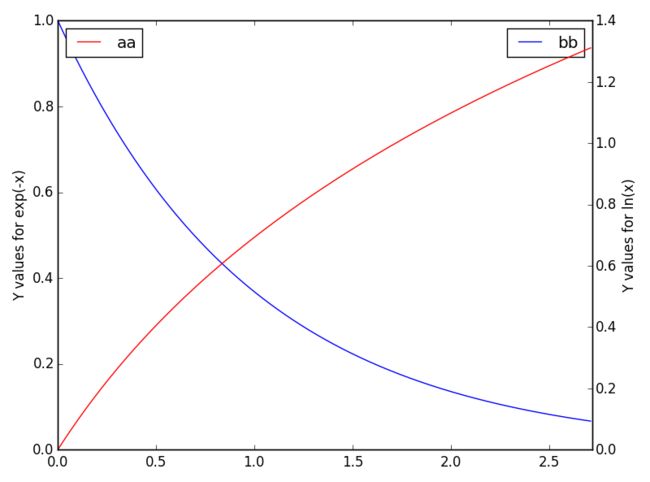
x = np.arange(0., np.e, 0.01)
y1 = np.exp(-x)
y2 = np.log(x+1)
fig = plt.figure()
ax1 = fig.add_subplot(111)
ax1.plot(x, y1,label='bb');
ax1.set_ylabel('Y values for exp(-x)');
ax2 = ax1.twinx() # this is the important function
ax2.plot(x, y2, 'r',label = 'aa');
ax2.set_xlim([0, np.e]);
ax2.set_ylabel('Y values for ln(x)');
ax2.set_xlabel('Same X for both exp(-x) and ln(x)');
ax1.legend()
ax2.legend(loc=0)
plt.show()
legend放一块儿
import numpy as np
import matplotlib.pyplot as plt
from matplotlib import rc

time = np.arange(10)
data1,data2 = np.random.random(10)*30,np.random.random(10)*100-10

fig = plt.figure()
ax = fig.add_subplot(111)

lns1 = ax.plot(time, data1, '-', label = 'data1')

ax2 = ax.twinx()
lns2 = ax2.plot(time, data2, '-r', label = 'data2')
ax2.tick_params(axis='y', colors='red') # 刻度颜色
ax2.spines['right'].set_color('red') # 纵轴颜色
setp(ax2.get_yticklabels(),color='r') # label颜色

lns = lns1+lns2
labs = [l.get_label() for l in lns]
ax.legend(lns, labs, loc=0)

ax.grid()
ax.set_xlabel("Time")
ax.set_ylabel(r"Radiation ")
ax2.set_ylabel(r"Temperature")

ax2.set_ylim(-20,100)
ax.set_ylim(0, 35)
多个子图共用一个legend
import matplotlib.pyplot as plt
from mpl_toolkits.axes_grid.axislines import SubplotZero

width = 1 # 两条柱之间的距离
num = 5 #柱的个数
ind = np.arange(num)

fig = plt.figure(figsize=(15, 4))
ax = SubplotZero(fig, 1, 3, 1)
ax1 = fig.add_subplot(ax)

means = [0.6481,0.6215,0.58,0.56,0.442]
stds = [0.0129,0.0119,0.01,0.009,0.003]

plt.bar(0.2+ind, means, 0.6*width,color=['k','r','c','y','r'], linewidth = 0.1, yerr=stds,error_kw=dict(elinewidth=1.5,ecolor='green'))
plt.axis([0,5,0,1])
plt.ylabel(u'wPrecision')
plt.grid()
plt.xticks([])


ax = SubplotZero(fig, 1, 3, 2)
ax2 = fig.add_subplot(ax)
means = [0.341,0.39,0.42,0.48,0.582]
stds = [0.0109,0.0149,0.02,0.011,0.009]
plt.bar(0.2+ind, means, 0.6*width, color=['k','r','c','y','r'], linewidth = 0.1, yerr=stds,error_kw=dict(elinewidth=1.5,ecolor='green'))
plt.axis([0,5,0,1])
plt.ylabel(u'wRecall')
plt.grid()
plt.xticks([])

ax = SubplotZero(fig, 1, 3, 3)
ax3 = fig.add_subplot(ax)
means = [0.68,0.6415,0.6,0.58,0.548]
stds = [0.02,0.0119,0.0099,0.009,0.007]
label = plt.bar(0.2+ind, means, 0.6*width, color=['k','r','c','y','r'],linewidth = 0.1, yerr=stds,error_kw=dict(elinewidth=1.5,ecolor='green'))
plt.axis([0,5,0,1])
plt.ylabel(u'wF1')
plt.grid()
plt.xticks([])

fig.legend((label[0], label[1],label[2], label[3],label[4]), ('SVD-Single', 'SVD-Multiple','JNE','SNE','R2P'), 'upper center' ,ncol=5)
savefig('comparison_baseline.png',dpi=250,bbox_inches='tight')