台湾国立大学郭彦甫Matlab教程笔记(13) 3D
3D plots
几个重要指令,重要函数。
functions:
线图
plot3: 3D line plot
几个画表面的图
surf: 3D shaded surface plot
surfc: contour plot under a 3D shaded surface plot 轮廓画图
surface: create surface object
meshc:plot a contour graph under mesh graph
contour : contour plot of matrix
contourf: filled 2D contour plot
2D vs.3D
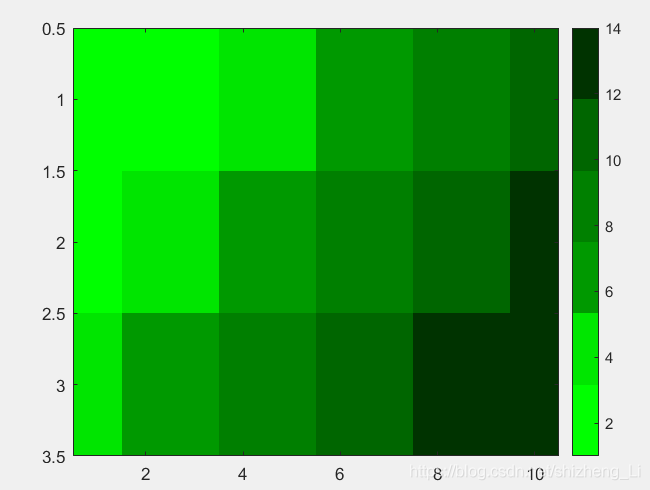
我们先跑一个二维的图形,以上次笔记上最后一个例程为例
我们可以把二维的图形转换为三维用matlab提供的 三位旋转按钮
三维旋转的效果:

原始2D跑出来的结果
x=[1:10;3:12;5:14];
imagesc(x);%显示颜色
map=[ 0 1 0;
   0 0.9 0;
   0 0.6 0;
   0 0.5 0;
   0 0.4 0;
   0 0.2 0];%自定义map颜色
colormap(map);%涂色,自定义颜色
colorbar;%显示右边关于色度的bar
有了这个印象,我们逐步开始看关于3D的一些指令
plot3()三维画线
画线line
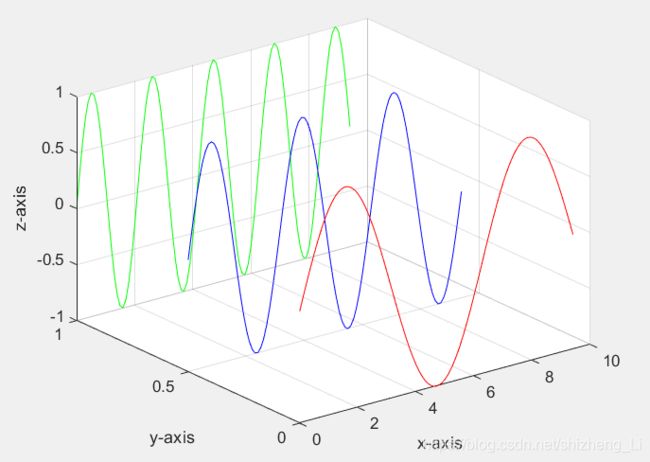
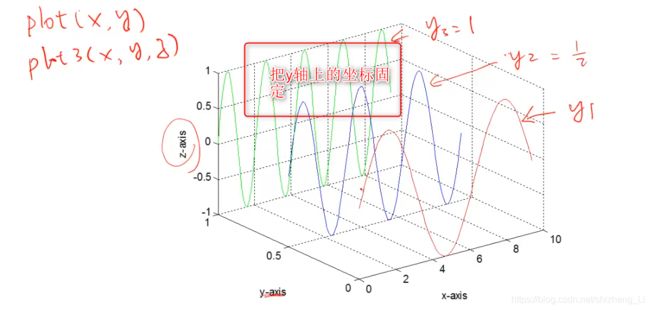
看一个例程:三维空间绘制三角函数sin()
x=0:0.1:3*pi;
z1=sin(x);%三个sin函数
z2=sin(2*x);
z3=sin(3*x);
y1=zeros(size(x));
y3=ones(size(x));
y2=y3./2;
plot3(x,y1,z1,'r',x,y2,z2,'b',x,y3,z3,'g');%plot3()三维画图
grid on;%打开栅格
xlabel('x-axis');ylabel('y-axis');zlabel('z-axis');%坐标轴名称
关于代码的解释:
这里
y1=zeros(size(x));
y3=ones(size(x));
y2=y3./2;
意思是:y1这个y轴上在y=0这个面上显示。
y3=1,表示这个图在y=1这个面上显示
y2=y3/2=0.5表示这个图在y=0.5这个面上显示
我们可以用plot3()函数画更多的图
more 3D Line Plots更多应用
原理就是x,y,z是三个向量,(x0,y0,z0)三个点描出来,多少个点描出来多少。这样就形成了空间中的line。
两个例程
程序源代码:
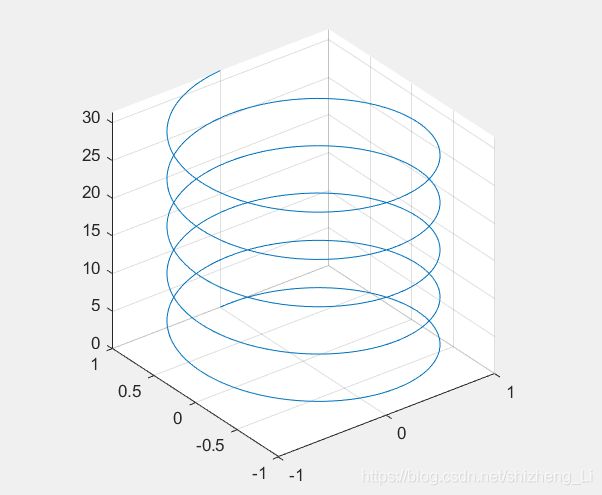
t=0:pi/50:10*pi;
plot3(sin(t),cos(t),t);%x坐标是sint,y坐标是cost,这样应该是个圆,
%然后纵坐标z随着时间上升,形成三维的螺旋线
grid on;
axis square;
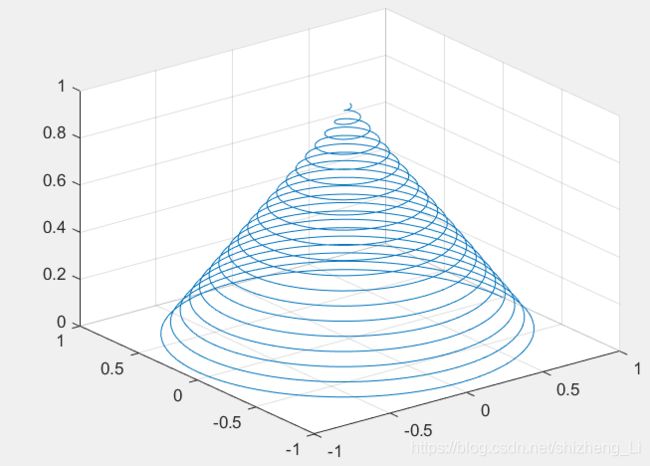
下面这个例子是三维的锥线
源程序代码:
turns=40*pi;
t=linspace(0,turns,4000);%时间从0到turns,中间有4000个取样点
x=cos(t).*(turns-t)./turns;%x和y随着时间增加而减少,圆的半径减少
y=sin(t).*(turns-t)./turns;
z=t./turns;
plot3(x,y,z);
grid on;
上面讲的都是line的图形,就是一条线在三维空间中移动。
常用的是三维的立体图 surface图形
principles for 3D surface plots贴图
surface的原理:
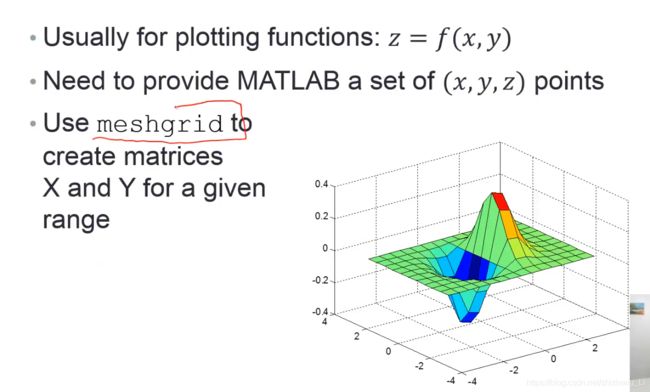
和line的原理不同,surface 的原理是x,y,z都是一个矩阵,x和y会形成一个网格。
x=-2:1:2;
y=-2:1:2;
[X,Y]=meshgrid(x,y)
执行的结果是如下的矩阵
X =

    -2    -1     0     1     2
    -2    -1     0     1     2
    -2    -1     0     1     2
    -2    -1     0     1     2
    -2    -1     0     1     2


Y =

    -2    -2    -2    -2    -2
    -1    -1    -1    -1    -1
     0     0     0     0     0
     1     1     1     1     1
     2     2     2     2     2
有了x和y形成的网格,我们就可以画图
画图基本的函数是
surface plots:mesh() and surf()
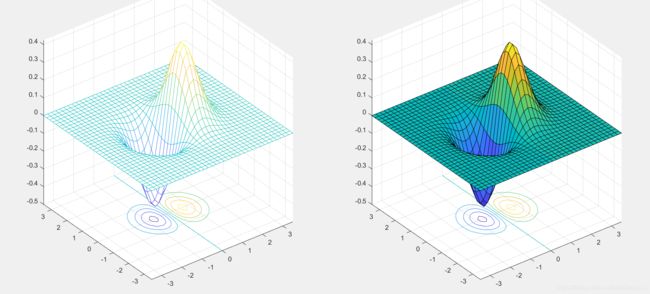
mesh得到的是网格,网格是空洞的。
surf是格子上面有贴图。
区别如下
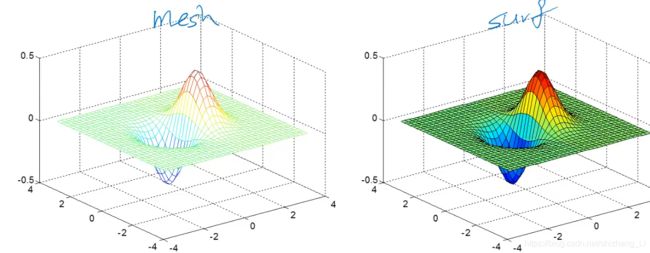
下面通过例程查看mesh和surf怎么用
通过绘制这个函数

程序:
x=-3.5:0.2:3.5;
y=-3.5:0.2:3.5;
[X,Y]=meshgrid(x,y);
Z=X.*exp(-X.^2-Y.^2);
subplot(1,2,1);mesh(X,Y,Z);
subplot(1,2,2);surf(X,Y,Z);
这个函数我们在高等数学中经常遇到,包括积分运算等等,现在我们可以通过matlab直接绘制出来其图像,简洁明了,极大地方便了我们的科研
我们再来看下一个函数
contour()轮廓
看一个例程:
x=-3.5:0.2:3.5;
y=-3.5:0.2:3.5;
[X,Y]=meshgrid(x,y);
Z=X.*exp(-X.^2-Y.^2);
subplot(2,1,1);
mesh(X,Y,Z);%画出网格图
axis square;
subplot(2,1,2);
contour(X,Y,Z);%等高线
axis square;
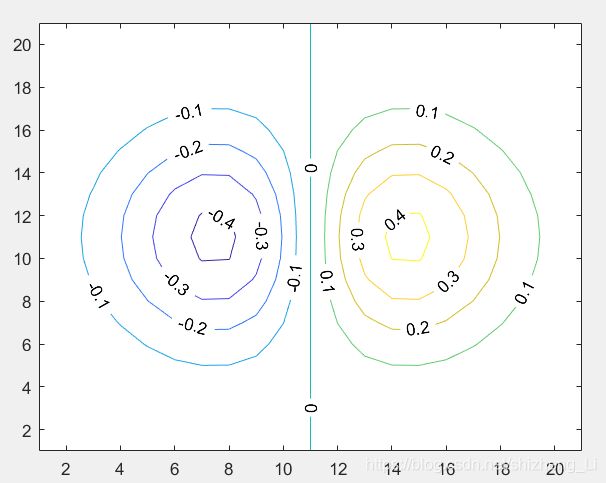
可以清楚看到contour投影的特点:相同高度的投影在同一圈。
Contour也有自己的变化
Various Contour plots
想让contour画出来的线更密集
1.可以在contour中加数值,让contour画线更紧密。
contour(Z,[-.45:.05:.45]);
2.也可以在contour图上标出数值。用clabel这个指令
clabel(C,h);
3.可以涂颜色
用contourf()来做。
x=-3.5:0.2:3.5;
y=-3.5:0.2:3.5;
[X,Y]=meshgrid(x,y);
Z=X.*exp(-X.^2-Y.^2);
subplot(1,3,1);
contour(Z,[-.45:.05:.45]);%用来让线更密集
axis square;
subplot(1,3,2);
[C,h]=contour(Z);
clabel(C,h);%用来标注数字
axis square;
subplot(1,3,3);
contourf(Z);%用来添加颜色
axis square;
作业:
我的练习:
思路:首先我要自己先回顾出来这个的三维图形过程:首先meshgrid产生x,y的网格
然后,写出来函数表达式。之后就是contour直接绘制。
运行这个版本,发现奇怪,明明设置了contour(Z,[-0.4:0.05:0.4]);,这个线的密度间隔应该是0.05,但是发现是这样的:间隔线密度并没有变化
经过修改,发现,这里面不能存在几个contour函数,前面的contour函数被后面的contour函数执行覆盖了。
踩坑:这是一个 错误的版本 ,出现的结果如上图所示,线密度并没有改变。
x=-2:0.2:2;
y=-2:0.2:2;
[X,Y]=meshgrid(x,y);
Z=X.*exp(-X.^2-Y.^2);
contour(Z,[-0.4:0.05:0.4]);
axis square;%坐标轴显示
[C,h]=contour(Z);
clabel(C,h);%标注数字
这个题的解决如下:
只需要一行代码同时实现三个功能:[C,h]=contourf(Z,[-0.4:0.05:0.4]);clabel(C,h);%添加数字表示
改变线了密度,出现数字,颜色覆盖。
最终代码:正确的版本
x=-2:0.1:2;
y=-2:0.1:2;
[X,Y]=meshgrid(x,y);
Z=X.*exp(-X.^2-Y.^2);
[C,h]=contourf(Z,[-0.4:0.05:0.4]);
axis square;%显示坐标轴
clabel(C,h);%添加数字表示
运行结果:
下面看函数
meshc() and surfc()
功能:
combination of surface/mesh and contours
把绘制表面和网格的函数与绘制等高线的函数结合
程式案例:
x=-3.5:0.2:3.5;
y=-3.5:0.2:3.5;
[X,Y]=meshgrid(x,y);
Z=X.*exp(-X.^2-Y.^2);
subplot(1,2,1);
meshc(X,Y,Z);
subplot(1,2,2);
surfc(X,Y,Z);
再来角度的部分 View Angle :view()
用两个角度来看物件的位置
这里两个角度分别是:
Azimuth and Elevation

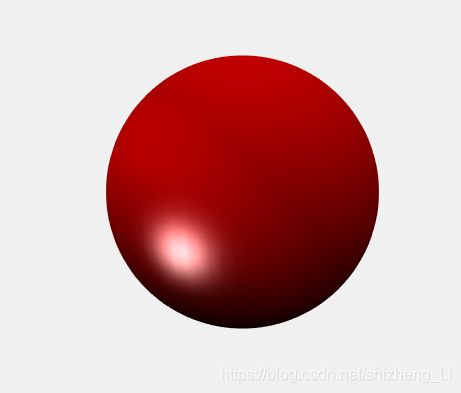
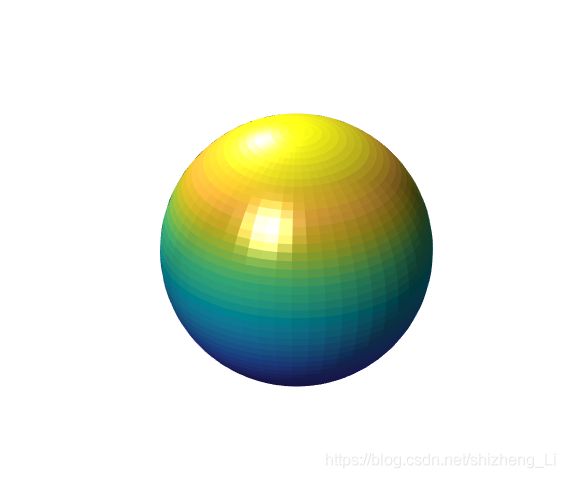
举例子,下面绘制一个三维的立体球,然后用view函数来从不同的角度查看这个球
sphere(50);
shading flat;
light('position',[1,3,2]);%添加灯光,让球更真实立体
light('position',[-3 -1 3]);
material shiny;
axis vis3d off;%不显示三维坐标系
set(gcf,'color',[1 1 1]);
画出来的结果是一个球
添加下面的代码:
view(-45,20)
给出的又是另一个视角
现在看光线的部分 Light:light()
打光的时候位置会变化
L1=light(‘position’,[-1 -1 -1]);
我们可以设置打光的位置
set(L1,‘position’,[-1,-1,-1]);
我们也可以设置光的颜色:比如绿色
set(L1,‘color’,‘g’);
可以选择位置
程序:
[X,Y,Z]=sphere(64);%球坐标系
 h=surf(X,Y,Z);%画出球
axis square vis3d off;%坐标轴不见
reds=zeros(256,3);
reds(:,1)=(0:256.-1)/255;%自定义颜色
colormap(reds);%上色
shading interp;
lighting phong;
set(h,'AmbientStrength',0.75,'DiffuseStrength',0.5);%设置
L1=light('position',[-1 -1 -1]);%打光的位置
再来
patch指令,用来画立体多边形
patch()
a graphical object containing polygons
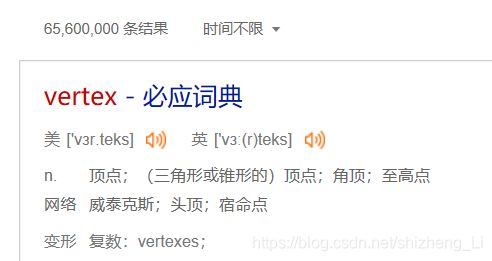
学习到:vertex是顶点的意思(在‘facevertexCData’中)
例程:自己看一下怎么使用理解
v=[0 0 0;
    1 0 0;
    1 1 0;
     0 1 0;
    0.25 0.25 1;
    0.75 0.25 1;
    0.75 0.75 1;
    0.25 0.75 1];
f=[ 1 2 3 4;
    5 6 7 8;
    1 2 6 5;
    2 3 7 6;
    3 4 8 7;
    4 1 5 8];
subplot(1,2,1);
patch('vertices',v,'faces',f,'facevertexCData',hsv(6),'facecolor','flat');
view(3);
axis square tight; grid on;
subplot(1,2,2);
patch('vertices',v,'faces',f,'facevertexCData',hsv(8),'facecolor','interp');
view(3);
axis square tight; grid on;
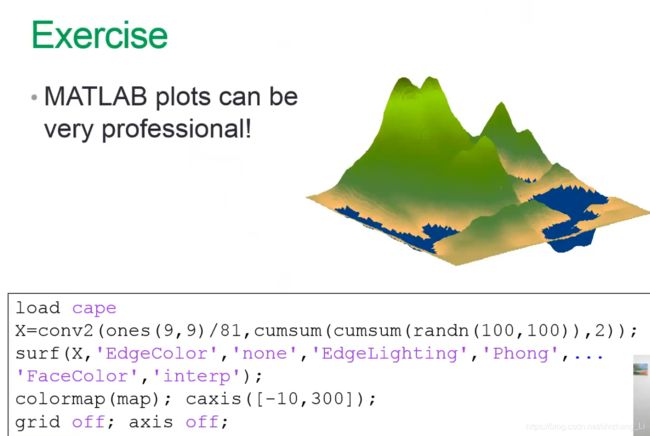
最后,看一下matlab画图非常专业
load cape
X=conv2(ones(9,9)/81,cumsum(cumsum(randn(100,100)),2));
surf(X,'edgecolor','none','edgelighting','phong','facecolor','interp');
colormap(map);
caxis([-10,300]);
grid off;
axis off;
自己跑一遍的结果:
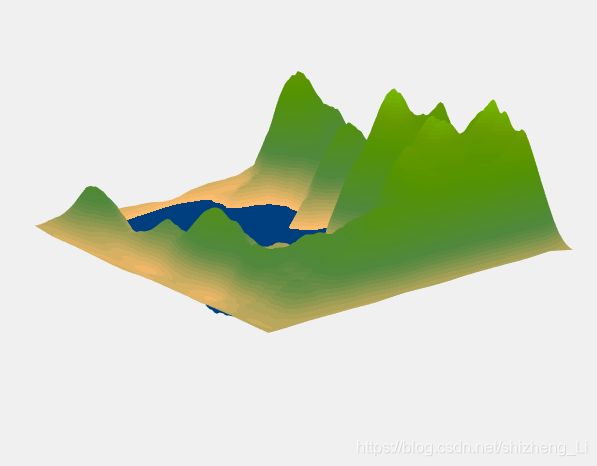
这个程序笔者还没有研究哦。后续可能会研究研究吧。
【总结】
本文记录的matlab3D画图的一些知识:
functions:
线图
plot3: 3D line plot
几个画表面的图
surf: 3D shaded surface plot
surfc: contour plot under a 3D shaded surface plot 轮廓画图
surface: create surface object
meshc:plot a contour graph under mesh graph
contour : contour plot of matrix
contourf: filled 2D contour plot
看物件角度的函数
view()
绘制立体多边形的函数
patch()
