绘制激活函数及其导数(pytorch)(基础版)
基本的激活函数及其导数绘图(导数部分使用pytorch的自动求导)
本文包括的激活函数有:
1.sigmoid
2.tanh
3.relu
4.leakyrelu
5.elu
准备绘图函数
%matplotlib inline
import torch
import numpy as np
import matplotlib.pylab as plt
import sys
sys.path.append("..")
from matplotlib import pyplot as plt
from IPython import display
from matplotlib import style

def xyplot(x_vals, y_vals, name):
    display.set_matplotlib_formats('svg')
    plt.rcParams['figure.figsize'] = (5, 3.5)
    plt.plot(x_vals.detach().numpy(), y_vals.detach().numpy(), label = name, linewidth=1.5, color='#FF0000')
    plt.grid(True,linestyle=':')
    plt.legend(loc='upper left')
    #dark_background, seaborn, ggplot
    plt.style.use("seaborn")
    ax = plt.gca()
    ax.spines['right'].set_color("none")
    ax.spines['top'].set_color("none")
    ax.spines['bottom'].set_position(("data",0))
    ax.spines['left'].set_position(("data",0))
    ax.spines['bottom'].set_linewidth(0.5)
    ax.spines['left'].set_linewidth(0.5)
    ax.xaxis.set_ticks_position('bottom')
    ax.yaxis.set_ticks_position('left')
(1)sigmoid
#sigmoid激活函数
x = torch.arange(-6.0, 6.0, 0.1, requires_grad=True)
y = x.sigmoid()
xyplot(x, y, 'sigmoid')

#导数
y.sum().backward()
xyplot(x, x.grad, 'grad of logistic')

(2)tanh
#tanh激活函数
x = torch.arange(-6.0, 6.0, 0.1, requires_grad=True)
y = x.tanh()
xyplot(x, y, 'tanh')

#导数
y.sum().backward()
xyplot(x, x.grad, 'grad of tanh')

(3)relu
#relu激活函数
x = torch.arange(-6.0, 6.0, 0.01, requires_grad=True)
y = x.relu()
xyplot(x, y, 'relu')

#导数
y.sum().backward()
xyplot(x, x.grad, 'grad of relu')

(4)leakyrelu
#leakyrelu激活函数
import torch.nn.functional as F
x = torch.arange(-6.0, 6.0, 0.1, requires_grad=True)
y = F.leaky_relu(x, negative_slope=0.1, inplace=False)
xyplot(x, y, 'leakyrelu(γ=0.1)')

#导数
y.sum().backward()
xyplot(x, x.grad, 'grad of leakyrelu')

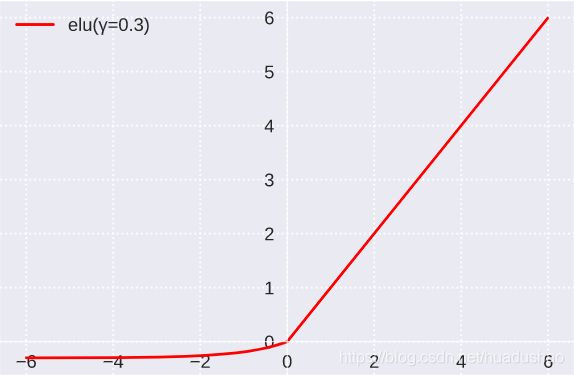
(5)elu
#elu激活函数
import torch.nn.functional as F
x = torch.arange(-6.0, 6.0, 0.01, requires_grad=True)
y = F.elu(x, alpha=0.3, inplace=False)
xyplot(x, y, 'elu(γ=0.3)')
#导数
y.sum().backward()
xyplot(x, x.grad, 'grad of elu(γ=0.3)')
