import matplotlib
import matplotlib.pyplot as plt
import numpy as np
import pandas as pd
from matplotlib import figure


stock_data = pd.read_csv('D:\\yangyang\\spy\\nltksample\\008\\600000.csv',
                         names=['data', 'no', 'comname', 'openprice',
                                'closeprice', 'meanprice'], encoding='gbk', nrows=100)
print(stock_data)
stockdata_new = pd.DataFrame(stock_data, columns=["data", "no", "comname"
    , "openprice", "closeprice", "meanprice"])
print(stockdata_new)
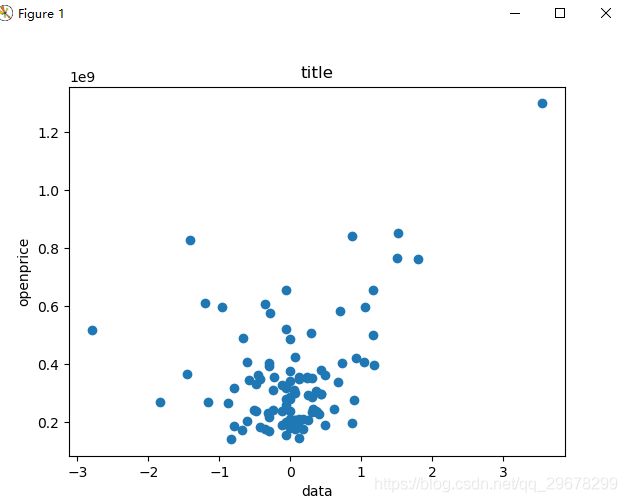
plt.figure()
plt.scatter(stock_data['data'], stock_data['openprice'])
plt.xlabel('data')  # added the name of the x axis
plt.ylabel('openprice')  # add label to y-axis
plt.title('title')  # add the title to your graph
plt.savefig("matplot1.jpg")  # savefig in local
plt.show()
plt.subplot(2, 2, 1)
plt.plot(stock_data['data'], stock_data['openprice'], 'r--')
plt.subplot(2, 2, 2)
plt.plot(stock_data['data'], stock_data['openprice'], 'g-*')
plt.subplot(2, 2, 3)
plt.plot(stock_data['data'], stock_data['openprice'], 'g--')
plt.subplot(2, 2, 4)
plt.plot(stock_data['data'], stock_data['openprice'], 'r-*')
plt.subplot(2, 2, 3)
# plt.plot(x, y, 'g--')
plt.subplot(2, 2, 4)
# plt.plot(x, y, 'r-*')
plt.savefig("matplot2.png")
plt.show()
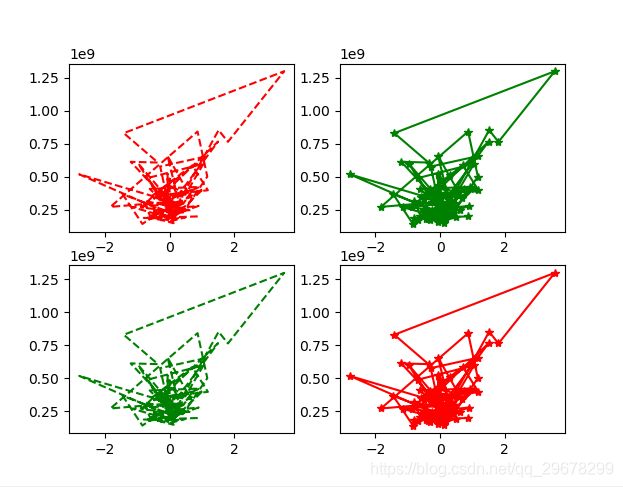
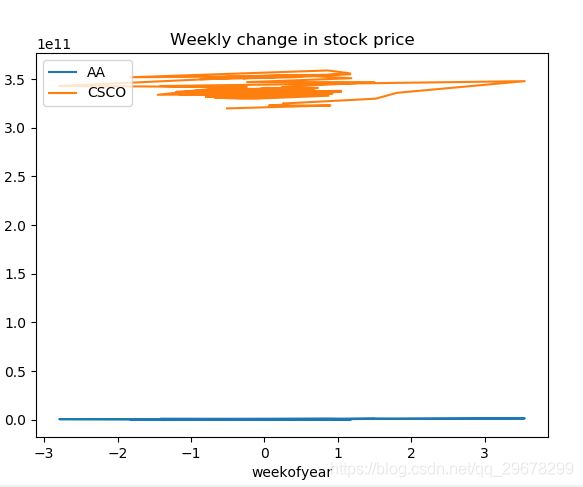
fig = plt.figure()
ax = fig.add_axes([0.1, 0.1, 0.8, 0.8])
ax.plot(stock_data['data'], stock_data['openprice'],label="AA")
ax.plot(stock_data['data'], stock_data['meanprice'],label="CSCO")
ax.set_xlabel('weekofyear')
ax.set_ylabel('stock value')
ax.set_title('Weekly change in stock price')
ax.legend(loc=2)  # upper left corner
plt.savefig("matplot3.jpg")
plt.show()
n = 12
X = np.arange(n)
Y1 = np.random.uniform(0.5, 1.0, n)
Y2 = np.random.uniform(0.5, 1.0, n)
plt.bar(X, +Y1, facecolor='#9999ff', edgecolor='white')
plt.bar(X, -Y2, facecolor='#ff9999', edgecolor='white')
plt.show()
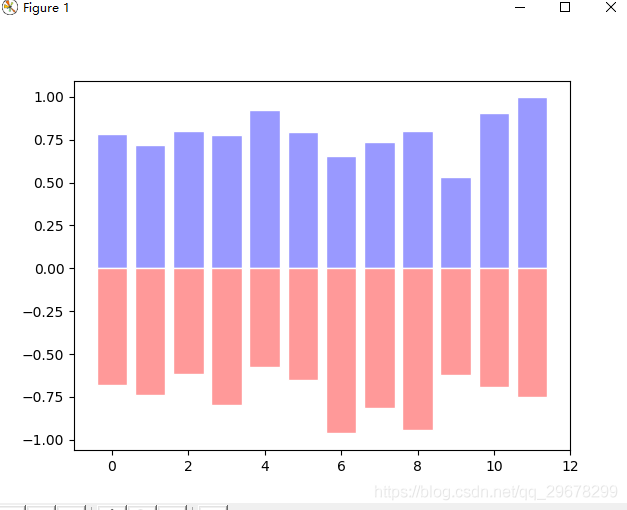
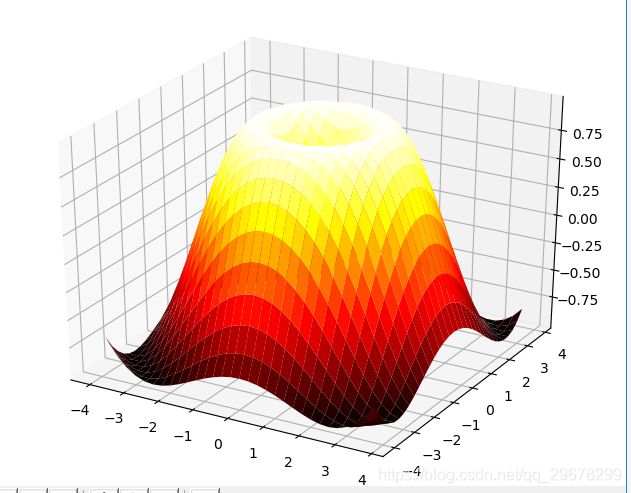
fig = plt.figure()
ax = Axes3D(fig)
X = np.arange(-4, 4, 0.25)
Y = np.arange(-4, 4, 0.25)
X, Y = np.meshgrid(X, Y)
R = np.sqrt(X**2 + Y**2)
Z = np.sin(R)
ax.plot_surface(X, Y, Z, rstride=1, cstride=1, cmap='hot')
plt.show()
