常用激活函数的python画图代码
引入模块
import numpy as np
import math
import matplotlib.pyplot as plt
e=math.e
1.sigmoid
def sigmoid(x):
return 1/(1+pow(e,-x))
x=np.linspace(-10,10,1000)
y=sigmoid(x)
plt.plot(x,y,linewidth=2)
2.tanh
def tanh(x):
return (e**x-e**(-x))/(e**x+e**(-x))
y=tanh(x)
plt.plot(x,y,linewidth=2)
3.relu
def relu(x):
return np.maximum(0,x)
y=relu(x)
plt.plot(x,y,linewidth=2)
4.lrelu和prelu(不对参数训练)
def lrelu(x):
return np.maximum(0.01*x,x)
def prelu(x):
return np.maximum(0.25*x,x)
y1=prelu(x)
plt.plot(x,y,linewidth=2,label='LRelu-0.01')
plt.plot(x,y1,color='orange',linewidth=2,label='PRelu-0.25')
plt.legend()
5.elu和selu
def elu(x):
if x<0:
return 1*((e**x)-1)
else:
return x
def selu(x,a,b):
return a*np.where(x > 0, x, b * ((e**x) - 1))
y=selu(x,1,1)
y1=selu(x,1.0506,1.67326)
plt.plot(x,y,linewidth=2,label='ELU-1')
plt.plot(x,y1,linewidth=2,color='orange',label='SELU-1.0506,1.67326')
plt.legend()
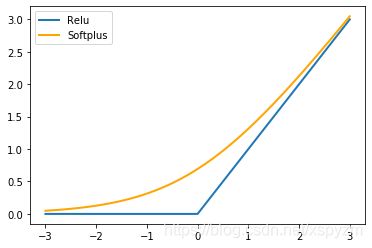
6.softplus
def softplus(x):
return math.log(1+pow(e,x))
x=np.linspace(-3,3,1000)
for i in range(1000):
y[i]=softplus(x[i])
y1=relu(x)
plt.plot(x,y1,linewidth=2,label='Relu')
plt.plot(x,y,color='orange',linewidth=2,label='Softplus')
plt.legend()
7.swish
def swish(x,a):
return x*sigmoid(a*x)
x=np.linspace(-3,3,1000)
y=swish(x,0.1)
y1=swish(x,1)
y2=swish(x,10)
plt.plot(x,y,linewidth=2,label='swish-0.1')
plt.plot(x,y1,color='orange',linewidth=2,label='swish-1')
plt.plot(x,y2,color='red',linewidth=2,label='swish-10')
plt.legend()
8.mish
def mish(x):
return x*tanh(softplus(x))
x=np.linspace(-5,5,1000)
for i in range(1000):
y[i]=mish(x[i])
plt.plot(x,y,color='orange',linewidth=2,label='Mish')
plt.legend()


