【量化笔记】ARCH效应检验及GARCH建模的python实现
ARCH效应检验
import pandas as pd
SHret=pd.read_table('TRD_IndexSum.txt', index_col='Trddt', sep='\t')
/Users/yaochenli/anaconda3/lib/python3.7/site-packages/ipykernel_launcher.py:1: FutureWarning: read_table is deprecated, use read_csv instead.
  """Entry point for launching an IPython kernel.
SHret.index=pd.to_datetime(SHret.index)
SHret.head()
| Retindex | |
|---|---|
| Trddt | |
| 2009-01-05 | 0.032904 |
| 2009-01-06 | 0.030004 |
| 2009-01-07 | -0.006780 |
| 2009-01-08 | -0.023821 |
| 2009-01-09 | 0.014205 |
import matplotlib.pyplot as plt
import numpy as np
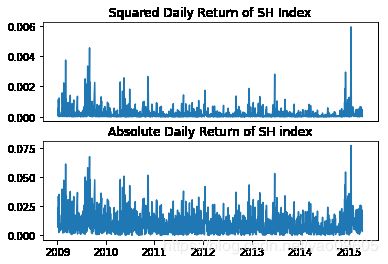
plt.subplot(211)
plt.plot(SHret**2)
plt.xticks([])
plt.title('Squared Daily Return of SH Index')

plt.subplot(212)
plt.plot(np.abs(SHret))
plt.title('Absolute Daily Return of SH index')
/Users/yaochenli/anaconda3/lib/python3.7/site-packages/pandas/plotting/_converter.py:129: FutureWarning: Using an implicitly registered datetime converter for a matplotlib plotting method. The converter was registered by pandas on import. Future versions of pandas will require you to explicitly register matplotlib converters.

To register the converters:
	>>> from pandas.plotting import register_matplotlib_converters
	>>> register_matplotlib_converters()
  warnings.warn(msg, FutureWarning)


Text(0.5, 1.0, 'Absolute Daily Return of SH index')
from statsmodels.tsa import stattools
LjungBox=stattools.q_stat(stattools.acf(SHret**2)[1:13],len(SHret))
LjungBox[1][-1]
2.2324582490602845e-43
p值明显的小于0.05,所以可以拒绝上证指数收益率的平方是白噪声。即原序列存在ARCH效应
GARCH建模 假设GARCH(1,1)
from arch import arch_model
am = arch_model(SHret)
model=am.fit()
Iteration:      1,   Func. Count:      6,   Neg. LLF: -4464.281255289449
Iteration:      2,   Func. Count:     19,   Neg. LLF: -4464.512186616303
Iteration:      3,   Func. Count:     32,   Neg. LLF: -4464.710590460396
Iteration:      4,   Func. Count:     45,   Neg. LLF: -4464.735814639209
Iteration:      5,   Func. Count:     61,   Neg. LLF: -4464.735819191423
Positive directional derivative for linesearch    (Exit mode 8)
            Current function value: -4464.735821909855
            Iterations: 9
            Function evaluations: 61
            Gradient evaluations: 5


/Users/yaochenli/anaconda3/lib/python3.7/site-packages/arch/univariate/base.py:577: ConvergenceWarning:
The optimizer returned code 8. The message is:
Positive directional derivative for linesearch
See scipy.optimize.fmin_slsqp for code meaning.

  ConvergenceWarning)
print(model.summary())
                     Constant Mean - GARCH Model Results
==============================================================================
Dep. Variable:               Retindex   R-squared:                      -0.000
Mean Model:             Constant Mean   Adj. R-squared:                 -0.000
Vol Model:                      GARCH   Log-Likelihood:                4464.74
Distribution:                  Normal   AIC:                          -8921.47
Method:            Maximum Likelihood   BIC:                          -8900.16
                                        No. Observations:                 1522
Date:                Wed, Aug 14 2019   Df Residuals:                     1518
Time:                        14:12:36   Df Model:                            4
                                  Mean Model
=============================================================================
                 coef    std err          t      P>|t|       95.0% Conf. Int.
-----------------------------------------------------------------------------
mu         3.3255e-04  3.181e-04      1.045      0.296 [-2.909e-04,9.561e-04]
                              Volatility Model
============================================================================
                 coef    std err          t      P>|t|      95.0% Conf. Int.
----------------------------------------------------------------------------
omega      3.7169e-06  8.137e-14  4.568e+07      0.000 [3.717e-06,3.717e-06]
alpha[1]       0.0500  3.320e-04    150.614      0.000 [4.935e-02,5.065e-02]
beta[1]        0.9300  3.204e-03    290.305      0.000     [  0.924,  0.936]
============================================================================

Covariance estimator: robust

WARNING: The optimizer did not indicate successful convergence. The message was
Positive directional derivative for linesearch. See convergence_flag.
ϵ t = σ t u t \epsilon_t=\sigma_t u_t ϵt=σtut
σ t 2 = 3.7169 ∗ 1 0 − 6 + 0.05 ϵ t − 1 2 + 0.93 σ t − 1 2 \\\sigma^2_t=3.7169*10^{-6}+0.05 \epsilon_{t-1}^2+0.93 \sigma^2_{t-1} σt2=3.7169∗10−6+0.05ϵt−12+0.93σt−12
