Matplotlib盒图
%matplotlib inline
import matplotlib.pyplot as plt
import numpy as np

data = [np.random.normal(0,std,100) for std in range(1,4)]
#画图区域大小
fig = plt.figure(figsize=(8,6))
#notch,两种不同的形状
#sym,离群点样式
#vert,水平或垂直方向
plt.boxplot(data,notch=False,sym='s',vert=True)
#x轴刻度
plt.xticks([y+1 for y in range(len(data))],['X1','X2','X3'])
plt.xlabel('x')
plt.title('test boxplot')

#修改线条颜色
for components in bplot.keys():
    for line in bplot[components]:
        line.set_color('green')
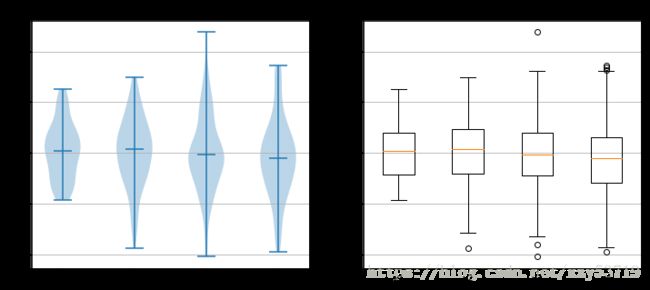
Matplotlib小提琴图
fig,axes = plt.subplots(nrows=1,ncols=2,figsize=(12,5))
tang_data = [np.random.normal(0,std,100) for std in range(6,10)]
axes[0].violinplot(tang_data,showmeans=False,showmedians=True)
axes[0].set_title('violin plot')

axes[1].boxplot(tang_data)
axes[1].set_title('box plot')

#设置格子
for ax in axes:
    ax.yaxis.grid(True)
    ax.set_xticks([y+1 for y in range(len(tang_data))])
plt.setp(axes,xticks=[y+1 for y in range(len(tang_data))],xticklabels=['x1','x2','x3','x4'])
[,
 ,
 ,
 ,
 Text(0,0,'x1'),
 Text(0,0,'x2'),
 Text(0,0,'x3'),
 Text(0,0,'x4'),
 ,
 ,
 ,
 ,
 Text(0,0,'x1'),
 Text(0,0,'x2'),
 Text(0,0,'x3'),
 Text(0,0,'x4')]

