产品和运营如何利用MLSQL完成excel处理
概览
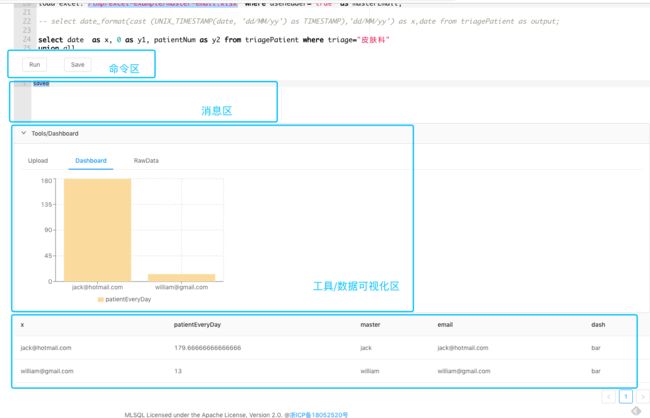
MLSQL Console 是一款集数据研发,数据分析,机器学习等于一体Web产品。他的目标是让产品,运营,分析师,研发,算法等都有一个统一的数据工作台。这篇文章重点面向产品和运营,在该文章中,他们会学习到如何在该平台上操作excel,关联多个excel,同时将结果进行图表化。
工作区介绍
快捷菜单区可以自动帮我们生成MLSQL语句,一般而言,用户只需要自己能够手动写一些select 语句即可。
待处理数据描述
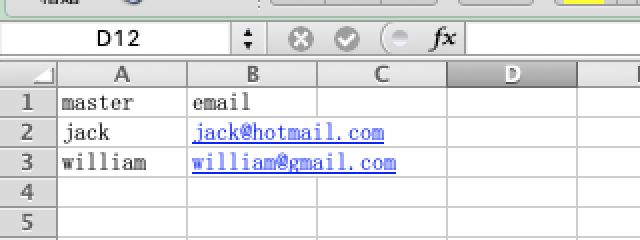
有两个excel文件:
内容分别如下:
第一个excel有每天每个科室的接待病人的数量。第二个excel有主任和对应的邮箱。
分析任务列表
现在我们的目标是:
- 绘制每个科室每天接收到病人的分布图,从而方便查看两个科室的就诊人数的分布情况。
- 找到日均就诊病人最多的那个医生的邮箱
- 将我们的分析结果保存成新的excel,并且下载到自己电脑。
任务一
我们大致会分成四个步骤:
- 将excel文档上传,上传完成后下载到自己的工作区得到操作路径
- 加载excel文件,然后给他们取表名
- 使用SQL对这些excel进行数据操作
- 使用SQL生成图标
下面我们看下具体步骤:
Step1:上传文件
打开操作界面的 Tools/Dashboard,然后拖拽excel-example(目录里包含了两个示例excel)到上传区进行上传操作:
上传成功后,拖拽Quick Menu/Download uploaded file到编辑区:
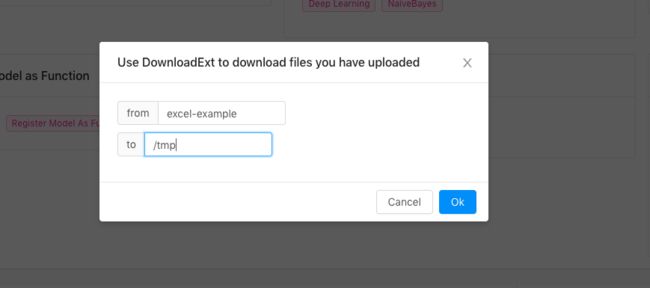
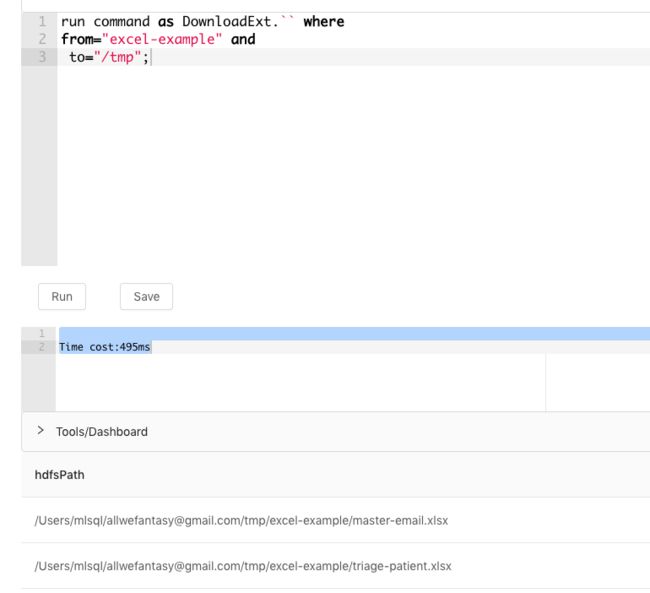
输入上传的文件夹名以及要保存的目录。点击Ok,系统会自动生成语句,点击运行,系统会显示文件下载的实际目录:
到此为止,我们的文件在远程服务器的路径为:
/tmp/excel-example/triage-patient.xlsx
/tmp/excel-example/master-email.xlsx
我们后面的步骤会用到。
Step2: 加载Excel并且查看
接着我们要加载我们的excel,把它们转化为SQL能操作的表。拖拽 Load data到编辑区:
填写路径以及表名。表名随意,只要你自己记得就行。点击Ok,那么就能生成对应的语句了。
同理完成另外一个脚本的处理。
这个时候你已经可以通过表名来查看内容了:
excel里的内容能够被正确的展示。
Step3: 对数据做预处理
现在我们开始用SQL绘图,我们需要的是折线图,横坐标是date, 纵坐标是patientNum两条曲线,分别是眼科和皮肤科。眼科对应的patientNum我们取名叫y1,皮肤科对应的patientNum叫y2。为了方便,我们先把把皮肤科的都过滤出来,然后y1设置为0,y2设置为实际的病人数,
同理眼科,然后把这些数据放到一起,最后的SQL大致如下:
select date  as x, 0 as y1, patientNum as y2 from triagePatient where triage="皮肤科"
union all
select date  as x, patientNum as y1, 0 as y2 from triagePatient where triage="眼科"
as tempTable;
Step4: 生成图表并分析
select x,sum(y1) as `眼科`,sum(y2) as `皮肤科`,
-- 告诉系统需要生成图表
"line" as dash
from tempTable where x is not null group by x order by x asc
as finalTable;
为了展示出图,横坐标名字一定要为x,然后通过dash参数告诉系统使用什么图做展示。这里是折线图,写line就好。最后的SQL大概是如下的:
我们点击运行,运行的结果如下:
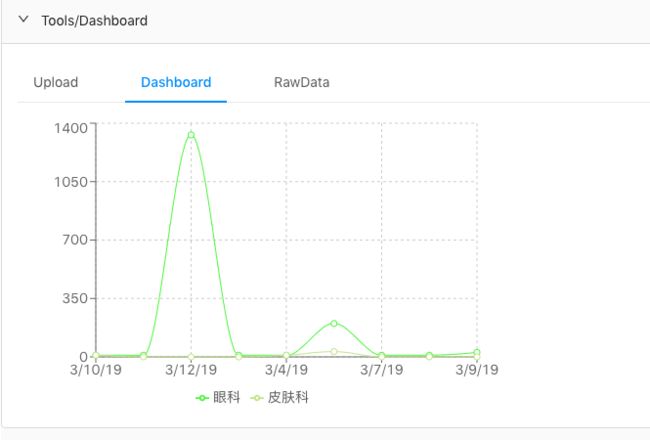
点击 Tools/Dashboard 查看图标:
可以看到 两者差异还是非常大的,而且皮肤科还有数据缺失。
任务二
因为我们已经做完了文件上传和加载excel文件等,所以任务二里,我们只要做数据预处理和生成图标即可。
Step1: 数据预处理
那么现在,第一个任务已经做好了,我们接着做第二任务,第二个任务核心就是要关联两张表,
这可以用Join语法:
select tp.*,me.email from triagePatient as tp  left join masterEmail as me on tp.master==me.master
as triagePatientWithEmail;
Step2: 生成图表并做分析
这样我们得到了一张新表,该表有email字段了。接着我们根据用户进行聚合:
select first(email) as x,
avg(patientNum) as patientEveryDay
"bar" as dash
from triagePatientWithEmail
group by master
order by patientEveryDay desc
as output;
我们用email做横坐标,然后平均病人数作为纵坐标的值,同时使用柱状图:
可以看到 jack@hotmail的科室日均接诊量遥遥领先。
任务三:保存和下载包含email的新表为excel文件
最后我们希望把triagePatientWithEmail表保存下来,然后下载到自己的电脑上。拖拽
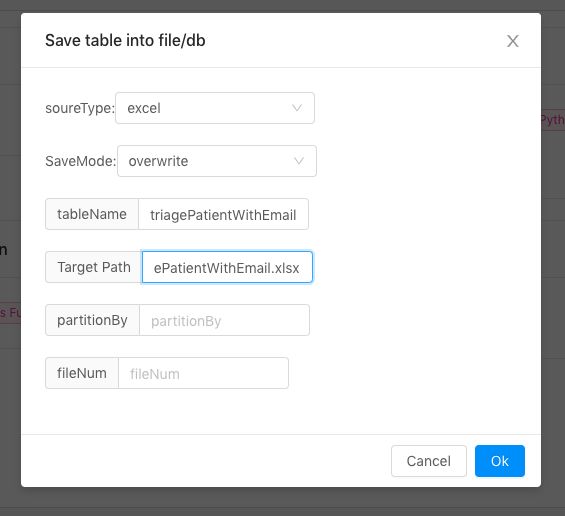
Save data到编辑区,打开对话框,选择excel格式,然后将triagePatientWithEmail 表保存到/tmp/triagePatientWithEmail.xlsx 文件:
点击ok后自动生成语句,然后点击运行,结果显示保存完毕。我们可以用前面查看excel的方法加载他:
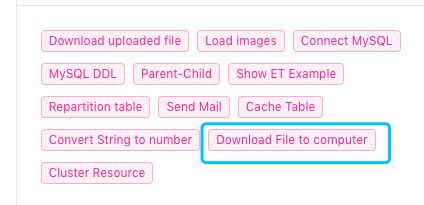
很完美。然后我们现在要下载他,拖拽
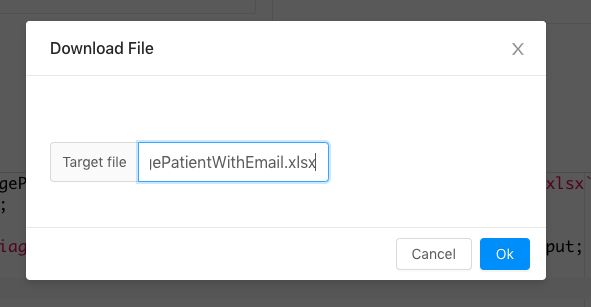
到编辑区,然后填写路径:
点击Ok,会打开新标签页进行下载。
完整脚本
最后完整脚本如下:
--------------------------------------------------------------------------------
-- 数据描述:
--
-- 我们有两个excel文件,第一个文件是每个科室每天接收的病人,并且有这个科室的负责人。
-- 第二个文件是科室负责人以及对应的email信息。
--
-- 需求描述:
-- 1. 我们希望看到科室每天接收到的人的一个时间分布图。
-- 2. 日均接收用户最高的科室负责人的email
--------------------------------------------------------------------------------

-- 需求一

-- 下载文件
-- run command as DownloadExt.`` where
-- from="excel-example" and
-- to="/tmp";

load excel.`/tmp/excel-example/triage-patient.xlsx` where useHeader="true"  as triagePatient;
load excel.`/tmp/excel-example/master-email.xlsx` where useHeader="true" as masterEmail;

-- select date_format(cast (UNIX_TIMESTAMP(date, 'dd/MM/yy') as TIMESTAMP),'dd/MM/yy') as x,date from triagePatient as output;

select date  as x, 0 as y1, patientNum as y2 from triagePatient where triage="皮肤科"
union all
select date  as x, patientNum as y1, 0 as y2 from triagePatient where triage="眼科"
as tempTable;

select x,sum(y1) as `眼科`,sum(y2) as `皮肤科`,
-- 告诉系统需要生成图表
"line" as dash
from tempTable where x is not null group by x order by x asc
as finalTable;

select tp.*,me.email from triagePatient as tp  left join masterEmail as me on tp.master==me.master
as triagePatientWithEmail;

select first(email) as x,
avg(patientNum) as patientEveryDay,master,first(email) as email,
"bar" as dash
from triagePatientWithEmail
group by master
order by patientEveryDay desc
as output;

save overwrite triagePatientWithEmail as excel.`/tmp/triagePatientWithEmail.xlsx`;

