使用Diskspd测试SQL Server存储子系统
In this article, we will learn how to test our storage subsystems performance using Diskspd. The storage subsystem is one of the key performance factors for SQL Server because SQL Server storage engine stores database objects, tables, and indexes on the physical files. Therefore, the storage engine always interacts with the disk subsystem because of data processing. In this context, when a bottleneck occurs on the storage subsystems, it causes a negative impact on SQL Server performance. It would be the right approach to measure the performance of the disks to be used before the SQL Server installation based on their usage purposes. For example, OLTP databases have to complete delete, insert, and update processes in a short time but OLAP databases handle a huge amount of batch data. In this case, the storage requirement of these two database systems should differ from each other. In short, it is a best practice to test and analyze the performance of the storage subsystems according to their usage purposes so that we can eliminate the I/O problems in advance.
在本文中,我们将学习如何使用Diskspd测试存储子系统的性能。 存储子系统是SQL Server的关键性能因素之一,因为SQL Server存储引擎将数据库对象,表和索引存储在物理文件上。 因此,由于数据处理,存储引擎始终与磁盘子系统交互。 在这种情况下,当存储子系统上出现瓶颈时,它将对SQL Server性能产生负面影响。 根据安装用途,在安装SQL Server之前评估要使用的磁盘的性能是正确的方法。 例如,OLTP数据库必须在短时间内完成删除,插入和更新过程,但是OLAP数据库处理大量的批处理数据。 在这种情况下,这两个数据库系统的存储要求应该彼此不同。 简而言之,最佳实践是根据其用途来测试和分析存储子系统的性能,以便我们可以提前消除I / O问题。
Firstly, we will shortly look into the essential disk measurement metrics before going into details about the Diskspd.
首先,在介绍有关Diskspd的详细信息之前,我们将很快研究基本的磁盘度量指标。
基本概念 (Basic Concepts)
IOPS (input/output operations per second) indicates how many operations are completed by the disk per second and this indicator is used to evaluate the performance of the storage. The IOPS is calculated by counting the transactions performed by the disk in one second and the amount of the data is not considered for this measurement method. So, only using this metric to decide the performance of the storage will be improper.
IOPS (每秒输入/输出操作)指示磁盘每秒完成多少操作,并且该指示器用于评估存储的性能。 IOPS是通过对磁盘在一秒钟内执行的事务进行计数来计算的,因此该测量方法不考虑数据量。 因此,仅使用此指标来确定存储性能将是不正确的。
Throughput indicates how much data can be transferred by the storage unit in a second. In general, it is measured in megabytes per second (MB/sec).
吞吐量指示存储单元在一秒钟内可以传输多少数据。 通常,以兆字节每秒(MB / sec)为单位进行度量。
Latency is a measurement of the response time of a storage device to the request it receives and its unit is the millisecond. Particularly for databases, high latency negatively affects performance. For example, the log files of the OLTP databases that are planned to receive high modification request should be placed on the disks which have low latency.
延迟是存储设备对接收到的请求的响应时间的度量,单位是毫秒。 特别是对于数据库,高延迟会对性能产生负面影响。 例如,应将计划接收高修改请求的OLTP数据库的日志文件放在具有低延迟的磁盘上。
什么是Diskspd? (What is Diskspd?)
The DiskSpd is a disk testing tool and it is used to measure and report the capability of the disk through generating various types of fake workloads. There are various disk performance benchmark tools (IOmeter, ATTO, HDTune, etc.) but this performance testing tool offers more realistic scenarios and reliable results, for this reason, it is preferred for the storage performance benchmarks. It can be used to analyze storage subsystem performance capabilities and limits with the help of a variety of parameters. Another advantage of this tool is that the results are offered as a text or XML output. However, the best thing is that it is open-source.
DiskSpd是磁盘测试工具,用于通过生成各种类型的假工作负载来测量和报告磁盘的功能。 有各种磁盘性能基准测试工具( IOmeter , ATTO , HDTune等),但是此性能测试工具可提供更真实的场景和可靠的结果,因此,它是存储性能基准测试的首选。 它可以借助各种参数来分析存储子系统的性能和限制。 该工具的另一个优点是结果以文本或XML输出的形式提供。 但是,最好的事情是它是开源的。
As a result, storage subsystems performance capabilities are the critical factors so it should be considered before any SQL Server installation.
因此,存储子系统的性能是关键因素,因此在安装任何SQL Server之前都应考虑它。
使用说明 (Usage Instructions)
DiskSpd can be downloaded from this link, A Robust Storage Performance Tool and does not require any installation or framework. The zip file contains every file which we needed.
可以从此链接( 一个功能强大的存储性能工具)下载DiskSpd,不需要任何安装或框架。 压缩文件包含我们需要的每个文件。
In this zipped file, we can find out three different release for the various systems:
在此压缩文件中,我们可以找到各种系统的三个不同版本:
- amd64: For 64 bit operating systems amd64 :用于64位操作系统
- x86: For 32 bit operating systems x86 :对于32位操作系统
- ARM64: For 32 bit operating systems ARM64:对于32位操作系统
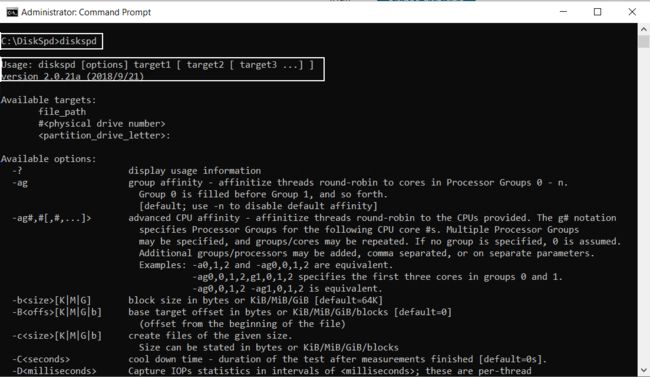
It is a command-line tool, for this reason, we need to open a command prompt with administrative rights and then we navigate the directory where we copied the diskspd.exe. When we execute the diskspd.exe without parameter on the command prompt, it returns version details and all parameter descriptions.
这是一个命令行工具,因此,我们需要打开具有管理权限的命令提示符,然后浏览复制diskspd.exe的目录。 当我们在命令提示符下执行不带参数的diskspd.exe时,它将返回版本详细信息和所有参数描述。
As we can see, diskspd.exe can be executed a variety of parameters but in the following table, we will look at the important ones and we can also find detailed information in Command line and parameters help documentation.
如我们所见,diskspd.exe可以执行各种参数,但是在下表中,我们将研究重要的参数,还可以在命令行和参数帮助文档中找到详细信息。
| Parameter |
Description |
| -b |
Block size in bytes and the default value is 64KB |
| -d |
The duration of the test and the default value is 10 seconds |
| -o |
The number of outstanding I/O requests per target per thread and the default value is 2 |
| -t |
Worker threads number per file |
| -h |
Disabling hardware write caching and software caching |
| -r |
Random I/O access and it can be overridden with the –s parameter |
| -w |
Percentage of write requests in the test |
| -c |
Specifies the size of the file that will be used in the test |
| -L |
Measure the latency information |
参数 |
描述 |
-b |
块大小(以字节为单位),默认值为64KB |
-d |
测试的持续时间,默认值为10秒 |
-o |
每个线程每个目标的未完成I / O请求数,默认值为2 |
-t |
每个文件的工作线程数 |
-H |
禁用硬件写缓存和软件缓存 |
-r |
随机I / O访问,可以用–s参数覆盖 |
-w |
测试中写入请求的百分比 |
-C |
指定将在测试中使用的文件的大小 |
-L |
测量延迟信息 |
测试方案 (Test Scenarios)
OLTP workload scenario: This scenario is based on the OLTP workload which involves high write activities. We can start the performance test with the following parameter but at first, we will describe the details of the parameters.
OLTP工作负载方案:此方案基于涉及大量写活动的OLTP工作负载。 我们可以使用以下参数开始性能测试,但首先,我们将描述这些参数的详细信息。
diskspd -b8K –d180 -h -L –o32 –t3 -r –w75 -c5G C:\Testdata\IO.dat > resultfile.txt
diskspd -b8K –d180 -h -L –o32 –t3 -r –w75 -c5G C:\ Testdata \ IO.dat> resultfile.txt
-b8K: SQL Server stores data in the pages and these pages size is 8KB therefore we will set block size parameter as 8KB.
-b8K : SQL Server将数据存储在页面中,这些页面的大小为8KB,因此我们将块大小参数设置为8KB。
–d180: The duration of the test will be 180 second
–d180 : 测试时间为180秒
-h: This parameter disables the caching mechanisms because SQL Server works this way.
-h :此参数禁用缓存机制,因为SQL Server以这种方式工作。
-L: With the help of this parameter, the latency statistics will be included in the report.
-L :借助此参数,延迟统计信息将包含在报告中。
-o32: The queue depth is set as 32 through this parameter
-o32 :通过此参数将队列深度设置为32
-t3: This parameter determines the number of threads.
-t3 :此参数确定线程数。
-r: SQL Server accesses data files randomly for this reason we set this parameter as random.
-r :由于这个原因,SQL Server随机访问数据文件,因此我们将此参数设置为random。
-c50G: This parameter sets the sample file size that will be used in the test.
-c50G :此参数设置将在测试中使用的样本文件大小。
–w75: The workload of the test will be 75 percent write and the remaining will be done as reading because the OLTP workload involves more writing activity than reading.
–w75 :测试的工作量将是75%的写入,其余的将作为读取完成,因为OLTP工作量涉及的写入活动大于读取。
C:\Testdata\io.dat: The sample file name that will be used in the test.
C:\ Testdata \ io.dat :将在测试中使用的示例文件名。
resultfile.txt: The output file of the test results.
resultfile.txt :测试结果的输出文件。
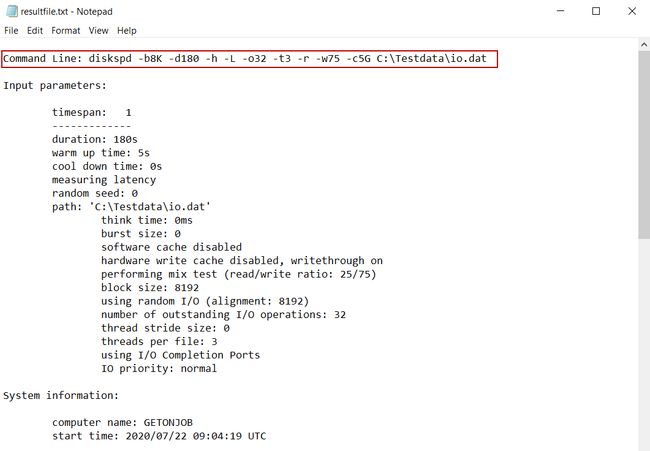
Interpreting the test results: After executing the test, the results will be written into the resultfile.txt file and we can separate the results of the test into 4 sections to interpret. The first section of the test result shows us the input parameters and any other settings.
解释测试结果:执行测试后,结果将被写入resultfile.txt文件,我们可以将测试结果分为4个部分进行解释。 测试结果的第一部分向我们显示了输入参数和任何其他设置。
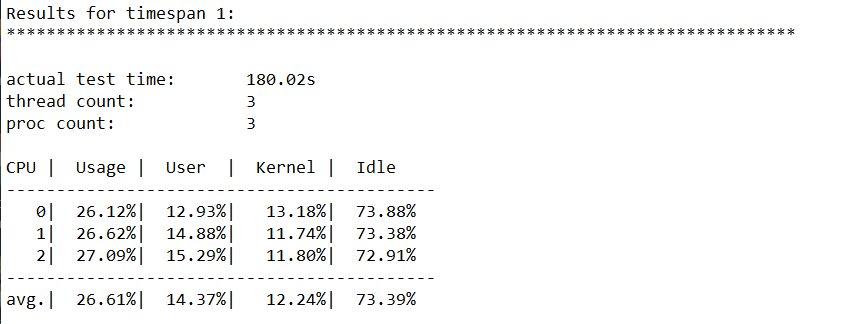
In the second section, we can find out the average CPU utilization details.
在第二部分中,我们可以找到平均CPU使用率详细信息。
The Total IO section gives us all performance details about the storage performance pieces of information. 54562 is the total IOPS generated for this test and the test duration is 180 seconds so the IOPS per second will be 54562/180 = 303.09. The AvgLat column indicates the average latency and the result is 316.204. The throughput per second is 2.37 MB/s.
Total IO部分为我们提供了有关存储性能信息的所有性能详细信息。 54562是此测试生成的总IOPS,测试持续时间为180秒,因此每秒IOPS将为54562/180 = 303.09 。 AvgLat列指示平均延迟,结果为316.204 。 每秒的吞吐量为2.37 MB / s 。
This storage performance is terrible and the latency does not have acceptable values so we can decide that this storage performance is not suitable for any database installation. The Read IO section gives details about the read operations and the Write IO section gives details about the write operations.
这种存储性能非常糟糕,并且延迟没有可接受的值,因此我们可以确定此存储性能不适合任何数据库安装。 Read IO部分提供有关读取操作的详细信息,而Write IO部分提供有关写入操作的详细信息。
The last section of the test results shows us the latency percentile analysis of the storage performance from the minimum value up to the maximum value. This result helps to figure out how the disks behave under a load.
测试结果的最后一部分向我们展示了存储性能从最小值到最大值的延迟百分比分析。 此结果有助于确定磁盘在负载下的行为。
Logfile (LDF) workload scenario: SQL Server log mechanism uses a memory space and the transactions will be written into this buffer area before written into the log file. The capacity of this area is 60 KB and this log data will be flushes into the disk on 60 KB chunks. Another consideration about the SQL log file is, the log data will be written sequentially. In light of this information, the performance test parameter looks like the following:
日志文件(LDF)工作负载方案: SQL Server日志机制使用内存空间,并且在将事务写入日志文件之前,会将事务写入此缓冲区。 该区域的容量为60 KB,该日志数据将以60 KB的块刷新到磁盘中。 关于SQL日志文件的另一个注意事项是,日志数据将被顺序写入。 根据此信息,性能测试参数如下所示:
diskspd –b60K –d60 -h -L –o32 –t1 -s –w100 –c1G C:\Testdata\LogIO.dat > resultLogFile.txt
diskspd –b60K –d60 -h -L –o32 –t1 -s –w100 –c1G C:\ Testdata \ LogIO.dat> resultLogFile.txt
Read-ahead scenario: Read-ahead mechanism is used by the SQL Storage Engine to bring continuous data pages into the buffer before the data is requested. In this mechanism, the storage engine can transfer 64 continuous data pages into the buffer. So we can set block size of the performance test as 512KB.
预读方案: SQL存储引擎使用预读机制将连续的数据页带入缓冲区,然后再请求数据。 通过这种机制,存储引擎可以将64个连续的数据页传输到缓冲区中。 因此我们可以将性能测试的块大小设置为512KB。
diskspd –b512K –d120 -h -L –o32 –t3 -si –w100 –c1G -s C:\Testdata\AheadIO.dat > resultRdAhead.txt
diskspd –b512K –d120 -h -L –o32 –t3 -si –w100 –c1G -s C:\ Testdata \ AheadIO.dat> resultRdAhead.txt
结论 (Conclusion)
In this article, we uncovered how to test the performance of storage subsystems with DiskSpd and we also did some analysis on various scenarios, particularly for SQL Server.
在本文中,我们揭示了如何使用DiskSpd测试存储子系统的性能,并且我们还针对各种情况进行了一些分析,尤其是针对SQL Server。
翻译自: https://www.sqlshack.com/using-diskspd-to-test-sql-server-storage-subsystems/


