一元线性回归预测:销售收入与广告支出实战
作者:herain R语言中文社区专栏作者
知乎ID:https://www.zhihu.com/people/herain-14
前言
数据挖掘的学习中,一元线性回归,通过现实生活中的企业销售和广告支出这两者之间的联系,进行线性回归模型的学习和形成商业二维变量分析的方法。
前提:一元回归的建模思路大致如下:
第一步:确定因变量与自变量之间的关系
第二步:建立线性关系模型,并对模型进行估计和检验
第三步:利用回归方程进行预测
第四步:对回归模型进行诊断
1.1 确定变量之间的关系
数据:企业的销售收入与广告支出的二维表:(example9_1数据框)
 example9_1
1.2 相关关系的描述
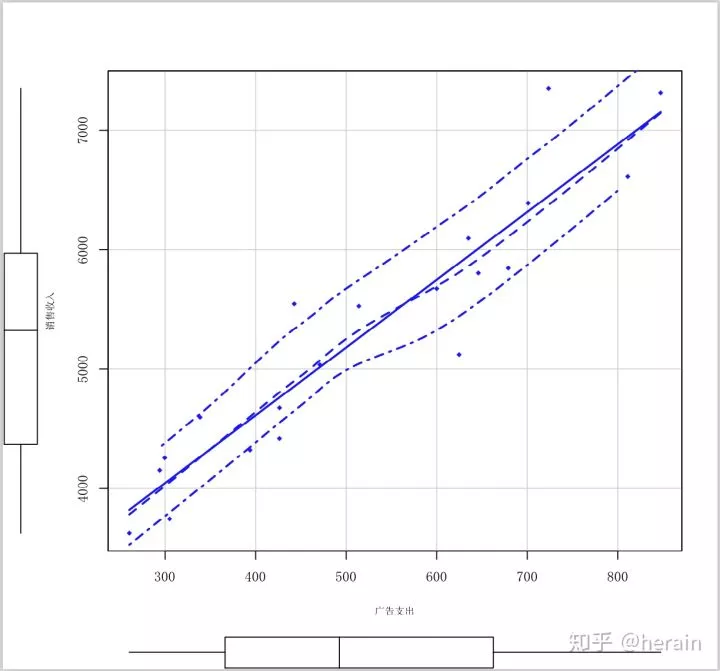
对数据example9_1用scatterplot图表化,一目了然变量之间的关系(初步结论 变量之间存在正向的线性关系):
library('car')
scatterplot(销售收入~广告支出, data=example9_1,spread=F,lty.smooth=1, pch=18, xlab="广告支出",ylab="销售收入",cex.lab=0.7, family = 'SimSun')
1.3 关系强度的度量
相关系数两变量之间线性关系强度的统计量r(也叫做pearson 相关系数,-1<=r<=1), 具体公式请参考资料。
> cor(example9_1[,2], example9_1[,3])
[1] 0.937114
相关系数的检验,用t分布检验:
第一步:提出假设:
原假设:两个变量的线性关系不显著
备择假设:两个变量的线性关系显著
第二步: 计算统计变量t:
install.packages("psych",repos="The Comprehensive R Archive Network")
library(psych)
cor.test(example9_1[,2], example9_1[,3])
Pearson’s product-moment correlation
data: example9_1[, 2] and example9_1[, 3]
t = 11.391, df = 18, p-value = 1.161e-09
alternative hypothesis: true correlation is not equal to 0
95 percent confidence interval:
0.8450142 0.9752189
sample estimates:
cor
0.937114
第三步:进行决策:统计量P值小于0.05,拒绝原假设,得出两个变量的线性关系显著
2.1 建立回归模型:

2.2 参数的最小二乘法估计:
 估计回归方乘的最小二乘法参数估计公式
一元线性回归(主要统计量,参数估计和检验值)

md <- lm(销售收入~广告支出, data= example9_1)

summary(md)

Call:

lm(formula = 销售收入 ~ 广告支出, data = example9_1)
Residuals:
Min 1Q Median 3Q Max
-766.30 -273.85 -26.79 174.73 900.66
Coefficients:
Estimate Std. Error t value Pr(>|t|)
(Intercept) 2343.8916 274.4825 8.539 9.56e-08 ***
广告支出 5.6735 0.4981 11.391 1.16e-09 ***
Signif. codes: 0 ‘’ 0.001 ‘’ 0.01 ‘’ 0.05 ‘.’ 0.1 ‘ ’ 1
Residual standard error: 394 on 18 degrees of freedom
Multiple R-squared: 0.8782, Adjusted R-squared: 0.8714
F-statistic: 129.8 on 1 and 18 DF, p-value: 1.161e-09
回归系数的置信区间:
> confint(md,level=0.95)
2.5 % 97.5 %
(Intercept) 1767.225152 2920.558006
广告支出 4.627092 6.719825
方差分析:
anova(md)
Analysis of Variance Table
Response: 销售收入
Df Sum Sq Mean Sq F value Pr(>F)
广告支出 1 20139304 20139304 129.76 1.161e-09 ***
Residuals 18 2793629 155202
Signif. codes: 0 ‘’ 0.001 ‘’ 0.01 ‘’ 0.05 ‘.’ 0.1 ‘ ’ 1
由R计算可知,销售收入与广告支出的估计方程为:
y = 2343.8916 + 5.6735 * 广告支出 (可以用于预测)
2.3 模型的拟合优度(回归直线与各观测点的接近程度),统计量是判定系数(可决系数)
2.3.1 决定系数
md <- lm(销售收入~广告支出, data= example9_1)

plot(销售收入~广告支出, data= example9_1, family = ‘SimSun’)

text(销售收入~广告支出,labels=企业编号,cex=0.6,adj=c(-0.6,0.25),col=4,family = ‘SimSun’)

abline(md, col=2,lwd=2)

n = nrow(example9_1)

for(i in 1:n){segments(example9_1[i,3], example9_1[i,2], example9_1[i,3],mdKaTeX parse error: Expected 'EOF', got '}' at position 11: fitted[i])}̲
mtext(expressi…广告支出

> pre_fit<-predict(md)

> con_int<-predict(md, data.frame(广告支出=x0), interval=“confidence”, level=0.95)

> pre_int<-predict(md, data.frame(广告支出=x0), interval=“prediction”, level=0.95)

> pre<-data.frame(y=example9_1$销售收入, pre_fit, lci = con_int[,2], uci=con_int[,3], lpi=pre_int[,2], upi=pre_int[,3])

> pre

      y  pre_fit      lci      uci      lpi      upi

1  4597.5 4264.925 3998.348 4531.501 3395.383 5134.467

2  6611.0 6945.066 6590.492 7299.641 6044.643 7845.490

3  7349.3 6448.639 6168.060 6729.217 5574.703 7322.575

4  5525.7 5260.049 5074.789 5445.310 4411.897 6108.201

5  4675.9 4763.054 4552.697 4973.412 3909.069 5617.039

6  4418.6 4762.487 4552.080 4972.894 3908.490 5616.484

7  5845.4 6196.170 5948.675 6443.664 5332.287 7060.053

8  7313.0 7151.013 6763.533 7538.493 6237.130 8064.896

9  5035.4 5015.523 4822.893 5208.154 4165.731 5865.315

10 4322.6 4578.100 4349.549 4806.650 3719.452 5436.747

11 6389.5 6320.986 6057.644 6584.328 5452.430 7189.542

12 4152.2 4011.888 3709.980 4313.796 3130.873 4892.904

13 5544.8 4854.964 4652.116 5057.813 4002.798 5707.131

14 6095.1 5946.538 5726.896 6166.179 5090.218 6802.857

15 3626.2 3821.828 3491.525 4152.130 2930.682 4712.973

16 3745.4 4074.296 3781.397 4367.196 3196.327 4952.266

17 5121.8 5888.101 5674.071 6102.132 5033.204 6742.998

18 5674.5 5747.967 5545.680 5950.254 4895.934 6600.000

19 4256.6 4043.660 3746.360 4340.960 3164.212 4923.107

20 5803.7 6008.946 5782.898 6234.994 5150.961 6866.931
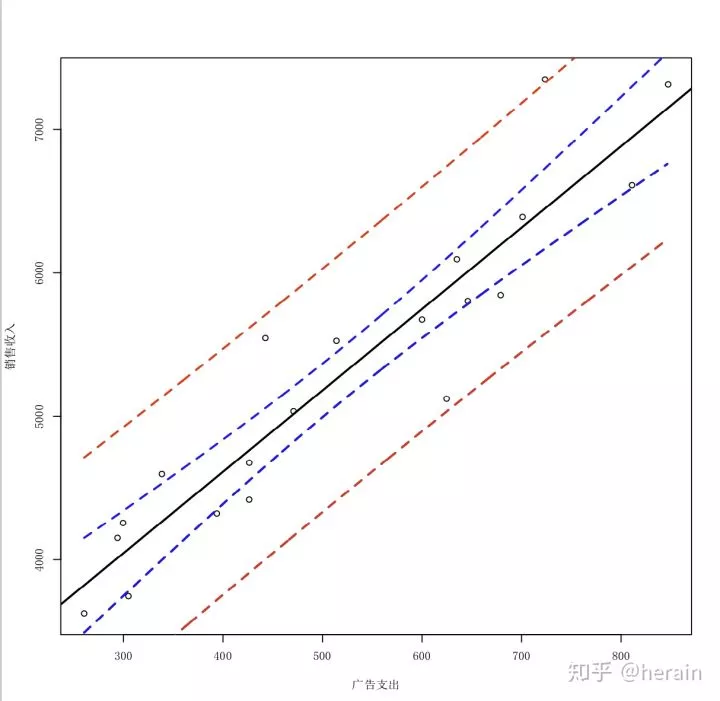
绘制图
> x0 <- seq(min(example9_1 广 告 支 出 ) , m a x ( e x a m p l e 9 1 广告支出),max(example9_1 广告支出),max(example91广告支出))
> con_int<-predict(md, data.frame(广告支出=x0), interval=“confidence”, level=0.95)
> pre_int<-predict(md, data.frame(广告支出=x0), interval=“prediction”, level=0.95)
> par(cex=0.7)
> plot(example9_1[,3], example9_1[,2], xlab=“广告支出”, ylab=“销售收入”,family = ‘SimSun’)
>
> abline(lm(example9_1[,2]~example9_1[,3]), lwd=2)
> lines(x0, con_int[,2],lty=2, lwd=2, col=‘blue’)
> lines(x0, con_int[,3],lty=2, lwd=2, col=‘blue’)
> lines(x0, pre_int[,2],lty=2, lwd=2, col=‘red’)
> lines(x0, pre_int[,3],lty=2, lwd=2, col=‘red’)
> legend(x=“topleft”, legend=c(“回归线”,“置信区间”,“预测区间”),lty=1:3,lwd=2,cex=0.7)
个别值的预测区间:
> x0<-data.frame(广告支出=500)
> predict(md, newdata=x0)
1
5180.621
> predict(md, x0, interval=“confidence”, level=0.95)
fit lwr upr
1 5180.621 4994.127 5367.115
> predict(md, x0, interval=“prediction”, level=0.95)
fit lwr upr
1 5180.621 4332.199 6029.043
>
4.1 残差(yi(实际值) -yi(估计值))与残差图
预测值(pre), 残差(res),标准化残差(zre)

> pre <-fitted(md)

> res<-residuals(md)

> zre<-mdKaTeX parse error: Expected 'EOF', got '&' at position 48: …residual(md)))
&̲gt; output<-…销售收入, pre, res, zre)

> output

       y      pre        res        zre

1  4597.5 4264.925  332.57536  0.8441934

2  6611.0 6945.066 -334.06646 -0.8479784

3  7349.3 6448.639  900.66117  2.2861954

4  5525.7 5260.049  265.65073  0.6743151

5  4675.9 4763.054  -87.15430 -0.2212283

6  4418.6 4762.487 -343.88696 -0.8729063

7  5845.4 6196.170 -350.76993 -0.8903777

8  7313.0 7151.013  161.98700  0.4111801

9  5035.4 5015.523   19.87679  0.0504543

10 4322.6 4578.100 -255.49955 -0.6485479

11 6389.5 6320.986   68.51398  0.1739126

12 4152.2 4011.888  140.31161  0.3561603

13 5544.8 4854.964  689.83567  1.7510460

14 6095.1 5946.538  148.56225  0.3771033

15 3626.2 3821.828 -195.62753 -0.4965716

16 3745.4 4074.296 -328.89643 -0.8348550

17 5121.8 5888.101 -766.30113 -1.9451423

18 5674.5 5747.967  -73.46670 -0.1864844

19 4256.6 4043.660  212.94024  0.5405174

20 5803.7 6008.946 -205.24580 -0.5209861
三种残差分布图
4.2 检验模型假定
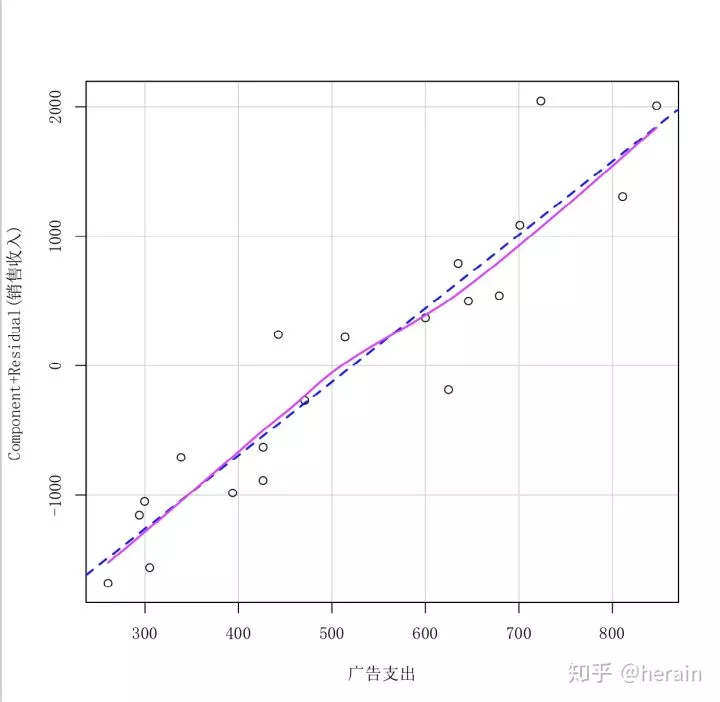
4.2.1 检验线性关系(F检验,残差图)
绘制残差图

> crPlots(md)

> crPlots(md,family = ‘SimSun’)
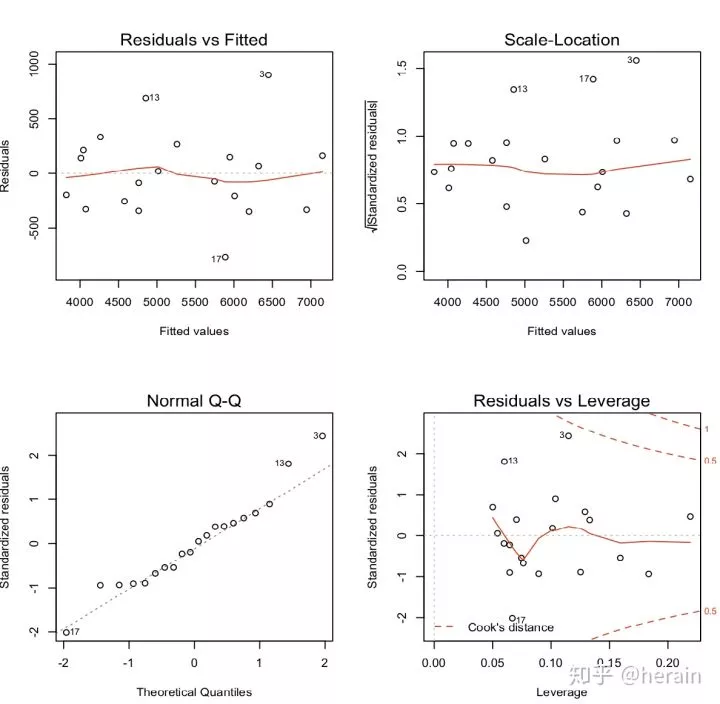
4.2.2 检验正态性(残差Q-Q图)
> par(mfcol=c(2,2), cex=0.7)

> plot(md)
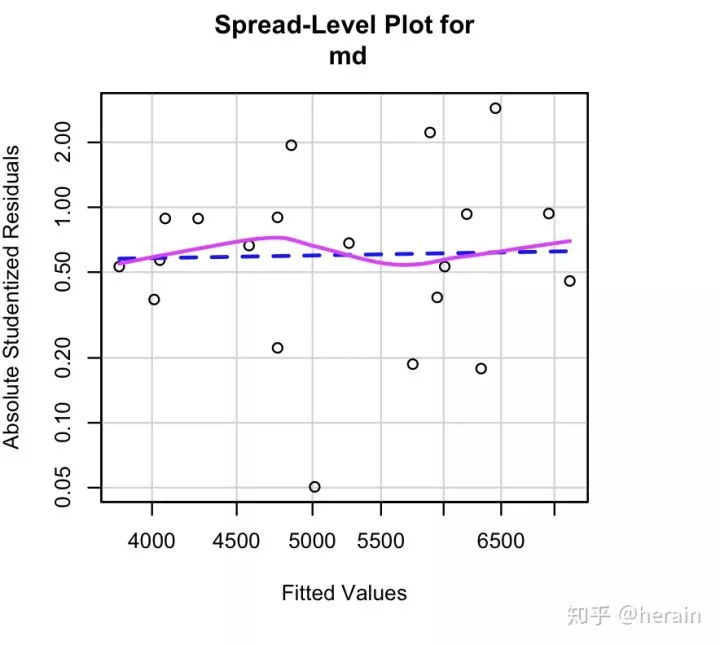
4.2.3 检验方差齐性
检验方差齐性

> library(car)

> ncvTest(md)

Non-constant Variance Score Test

Variance formula: ~ fitted.values

Chisquare = 1.126441, Df = 1, p = 0.28854

绘制散步 --水平图

spreadLevelPlot(md)
4.2.4 检验独立性
> durbinWatsonTest(md)

lag Autocorrelation D-W Statistic p-value

  1       0.1330482      1.679232    0.44

Alternative hypothesis: rho != 0
验证步骤省略:检测P值等于 0.44, 不拒绝原假设,表名残差无自相关性。
写在最后:
至此,一元线性回归方程的完成,欢迎大家指正,请各位多多转发,给我好看。
公众号后台回复关键字即可学习
回复 爬虫 爬虫三大案例实战
回复 Python 1小时破冰入门回复 数据挖掘 R语言入门及数据挖掘
回复 人工智能 三个月入门人工智能
回复 数据分析师 数据分析师成长之路
回复 机器学习 机器学习的商业应用
回复 数据科学 数据科学实战
回复 常用算法 常用数据挖掘算法
