pandas 常用操作
DataFrame的样子
年龄 性别 手机号
0 2 男 NaN
1 3 女 NaN
2 4 NaN NaN
1. DataFrame表的合并
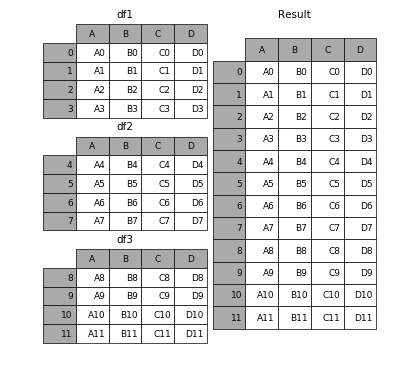
- 具有相同字段的表首尾相接

# 现将表构成list,然后在作为concat的输入
In [4]: frames = [df1, df2, df3]
In [5]: result = pd.concat(frames)
2. 删除常量属性
# remove more constant columns(anyone have a fast one liner for this?)
# for i in hdd_st4.columns:
#    if len(hdd_st4.loc[:,i].unique()) == 1:
#        hdd_st4.drop(i, axis=1, inplace=True)
3. 删除DataFrame中元素的空格
直接使用Series的.apply方法来修改变量VIN中的每个值。如果发现是空格,就返回Nan,否则就返回原值。
df["VIN"]=df["VIN"].apply(lambda x: np.NaN if str(x).isspace() else x)
df_null = df[df["VIN"].isnull()]
df_not_null = df[df["VIN"].notnull()]
思路是先把空格转换为NaN,然后正常使用.isnull()或.notnull()来得到我们想要的数据
4.处理缺失值
- 删除NaN所在的行:
删除表中全部为NaN的行
df.dropna(axis=0,how='all')
删除表中含有任何NaN的行
df.dropna(axis=0,how='any') #drop all rows that have any NaN values
- 删除NaN所在的列:
删除表中全部为NaN的行
df.dropna(axis=1,how='all')
删除表中含有任何NaN的行
df.dropna(axis=1,how='any') #drop all rows that have any NaN values
5. ValueError: could not convert string to float: ?
csv中的缺失值用?(最起码Weka中是这个样子的)表示,所以要转换成NaN或者其他指定的值
6. pandas 执行sql
import pandas as pd
import pandasql as ps

df = pd.DataFrame([[1234, 'Customer A', '123 Street', np.nan],
               [1234, 'Customer A', np.nan, '333 Street'],
               [1233, 'Customer B', '444 Street', '333 Street'],
              [1233, 'Customer B', '444 Street', '666 Street']], columns=
['ID', 'Customer', 'Billing Address', 'Shipping Address'])

q1 = """SELECT ID FROM df """

print(ps.sqldf(q1, locals()))

     ID
0  1234
1  1234
2  1233
3  1233
7. set_index和reset_index
- set_index()
将DataFrame中的列columns设置成索引index
打造层次化索引的方法
# 将columns中的其中两列:race和sex的值设置索引,race为一级,sex为二级
# inplace=True 在原数据集上修改的
adult.set_index(['race','sex'], inplace = True)

# 默认情况下,设置成索引的列会从DataFrame中移除
# drop=False将其保留下来
adult.set_index(['race','sex'], inplace = True)
- reset_index()
将使用set_index()打造的层次化逆向操作
既是取消层次化索引,将索引变回列,并补上最常规的数字索引
df.reset_index()
8. list to DataFrame
L = ['Thanks You', 'Its fine no problem', 'Are you sure']
#create new df
df = pd.DataFrame({'col':L})
print (df)

                   col
0           Thanks You
1  Its fine no problem
2         Are you sure
GroupBy
import pandas as pd
import numpy as np
from pandas import Series,DataFrame

if __name__=="__main__":
    df = DataFrame({'key1':['a','a','b','b','a'],
               'key2':['one','two','one','two','one'],
               'data1':np.random.randn(5),
               'data2':np.random.randn(5)})
    print(df)

    # grouped = df['data1'].groupby(df['key1'])
    # print(grouped)
    # print(grouped.mean())

    # means = df['data1'].groupby([df['key1'],df['key2']]).mean()
    # print(means)
    # print(means.unstack())

    # states = pd.Series(['Ohio','calfornia','calfornia','Ohio','Ohio'])
    # years = pd.Series([2005,2006,2005,2005,2006])
    # print(states)
    # print(years)
    # print(df['data1'].groupby([states,years]).mean().unstack())

    # print(df.groupby('key1').mean())

    # print(df.groupby(['key2','key1']).size())

    # """
    #
    #     a
    #       key1 key2     data1     data2
    #     0    a  one -0.968232  0.203869
    #     1    a  two  0.608665 -0.801282
    #     4    a  one  1.684846  1.773606
    #
    #     b
    #       key1 key2     data1     data2
    #     2    b  one -0.897505 -0.401539
    #     3    b  two  1.262484 -0.437004
    # """
    # for name,group in df.groupby('key1'):
    #     print(type(name),type(group))
    #     print(name)
    #     print(group)

    # print("now now")
    # for (k1,k2),group in df.groupby(['key1','key2']):
    #     print(k1,k2)
    #     print(group)

    # """
    #     {'a':   key1 key2     data1     data2
    #     0    a  one  0.948510  1.006365
    #     1    a  two  2.107954  2.344624
    #     4    a  one  0.517203 -0.751500, 'b':   key1 key2     data1     data2
    #     2    b  one -1.114221 -1.777285
    #     3    b  two -1.621047 -1.407061}
    #       key1 key2     data1     data2
    #     0    a  one  0.948510  1.006365
    #     1    a  two  2.107954  2.344624
    #     4    a  one  0.517203 -0.751500
    # """
    # pices = dict(list(df.groupby('key1')))
    # print(pices)
    # print(pices['a'])

    grouped_s = df.groupby(['key1','key2'])['data2']
    print(grouped_s)
    print(grouped_s.mean())