缩放数据抵抗噪声
scikit-learn KNN
导入数据
import pandas as pd
%matplotlib inline
import matplotlib.pyplot as plt
plt.style.use('ggplot')
df = pd.read_csv('winequality-red.csv ' , sep = ';')
X = df.drop('quality' , 1).values # drop target variable
y1 = df['quality'].values
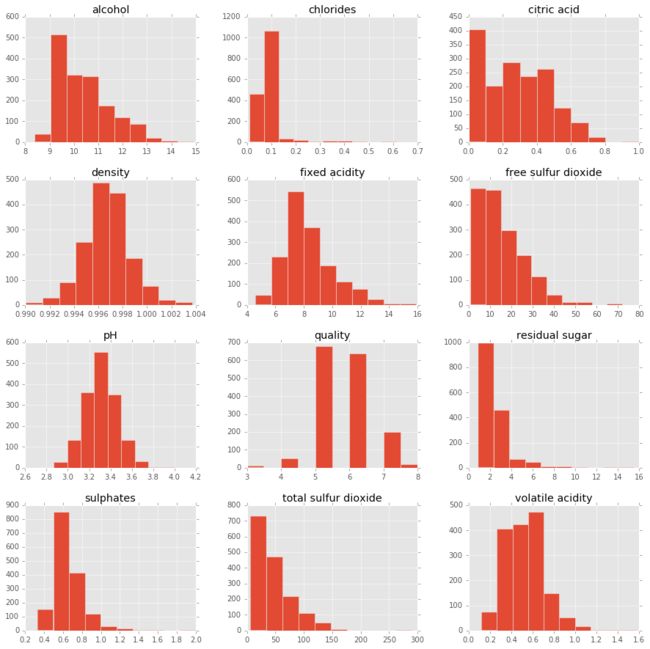
pd.DataFrame.hist(df, figsize = [15,15]);
回归问题转换成分类问题
y = y1 <= 5 # is the rating <= 5?
# plot histograms of original target variable
# and aggregated target variable
plt.figure(figsize=(20,5));
plt.subplot(1, 2, 1 );
plt.hist(y1);
plt.xlabel('original target value')
plt.ylabel('count')
plt.subplot(1, 2, 2);
plt.hist(y)
plt.xlabel('aggregated target value')
plt.show()
性能度量指标:
- 准确率(Accuracy):正确预测数目除以总的预测数目。
- 精度(Precision):真阳性样例数目除以真和假阳性样例数目
- 召回率(recall): 用真阳性样例数目除以真阳性和假阴性样例数目。
- F1-score:精度和召回率的调和平均数。
划分数据为训练集和测试集
from sklearn.cross_validation import train_test_split
X_train, X_test, y_train, y_test = train_test_split(X, y, test_size=0.2, random_state=42)- test_size:测试集大小比率
- random_state: 随机数生成器种子
训练和测试模型
from sklearn import neighbors, linear_model
knn = neighbors.KNeighborsClassifier(n_neighbors = 5)
knn_model_1 = knn.fit(X_train, y_train)
print('k-NN accuracy for test set: %f' % knn_model_1.score(X_test, y_test))
k-NN accuracy for test set: 0.612500
导出模型的分类报告
from sklearn.metrics import classification_report
y_true, y_pred = y_test, knn_model_1.predict(X_test)
print(classification_report(y_true, y_pred))
precision recall f1-score support
False 0.66 0.64 0.65 179
True 0.56 0.57 0.57 141
avg / total 0.61 0.61 0.61 320
False,True 分别是反例和正例样本
预处理机制:缩放和中心化
是预处理数值型数据最基本的方法。
- 标准化,所有的标准化操作就是将数据集缩放,使其最小值为0,最大值为1。为实现这一目标,我们将数据点x变换成 :
xnormalized=x−xminxmax−xmin - 规范化,将数据向0集中,使用标准差进行缩放:
xnormalized=x−μσ
μ和σ分别表示数据集的平均值和标准差。这些变换仅仅改变数据的范围而没有改变其分布。之后你可能会使用其他的变换,比如log变换或者Box-Cox变换,让数据更像高斯分布(如钟形曲线)。
预处理:缩放实战
from sklearn.preprocessing import scale
Xs = scale(X)
from sklearn.cross_validation import train_test_split
Xs_train, Xs_test, y_train, y_test = train_test_split(Xs, y, test_size=0.2, random_state=42)
knn_model_2 = knn.fit(Xs_train, y_train)
print('k-NN score for test set: %f' % knn_model_2.score(Xs_test, y_test))
print('k-NN score for training set: %f' % knn_model_2.score(Xs_train, y_train))
y_true, y_pred = y_test, knn_model_2.predict(Xs_test)
print(classification_report(y_true, y_pred))
k-NN score for test set: 0.712500
k-NN score for training set: 0.814699
precision recall f1-score support
False 0.72 0.79 0.75 179
True 0.70 0.62 0.65 141
avg / total 0.71 0.71 0.71 320
scikit-learn LR
数据可视化
# Import necessary packages
import pandas as pd
%matplotlib inline
import matplotlib.pyplot as plt
plt.style.use('ggplot')
from sklearn import datasets
from sklearn import linear_model
import numpy as np
# Load data
boston = datasets.load_boston()
yb = boston.target.reshape(-1, 1)
Xb = boston['data'][:,5].reshape(-1, 1)
# Plot data
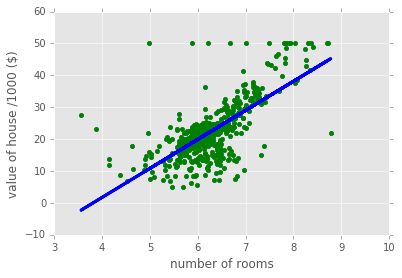
plt.scatter(Xb,yb)
plt.ylabel('value of house /1000 ($)')
plt.xlabel('number of rooms')
# Create linear regression object
regr = linear_model.LinearRegression()
# Train the model using the training sets
regr.fit( Xb, yb)
# Plot outputs
plt.scatter(Xb, yb,  color='g')
plt.plot(Xb, regr.predict(Xb), color='blue',
         linewidth=3)
plt.show()
逻辑回归python实现
逻辑函数:
F(x)=11+e−(ax+b)
这是一条sigmoidal(S形)曲线,如下图。对于任意x,如果F(x)<0.5,那么逻辑模型给出预测y=0,相反,如果F(X)>0.5,那么模型预测y=1。在有多个预测变量的情况下,我们有n个系数a1,…,an,每一个对应一个预测变量。在这种情况下,ai的大小告诉我们对应变量对预测变量的影响程度。
# Synthesize data
X1 = np.random.normal(size=150)
y1 = (X1 > 0).astype(np.float)
X1[X1 > 0] *= 4
X1 += .3 * np.random.normal(size=150)
X1= X1.reshape(-1, 1)
X1_ordered = sorted(X1)
# Run the classifier
clf = linear_model.LogisticRegression()
clf.fit(X1, y1)
# Plot the result
plt.scatter(X1.ravel(), y1, color='black', zorder=20 , alpha = 0.5)
plt.plot(X1_ordered, clf.predict_proba(X1_ordered)[:,1], color='blue' , linewidth = 3)
plt.ylabel('target variable')
plt.xlabel('predictor variable')
plt.show()
逻辑回归和数据缩放:红酒数据集
# Import necessary modules
from sklearn import linear_model
from sklearn.cross_validation import train_test_split
# Load data
df = pd.read_csv('winequality-red.csv ' , sep = ';')
X = df.drop('quality' , 1).values #drop target variable
y1 = df['quality'].values
y = y1 <= 5 # is the rating <= 5?
# plot histograms of original target variable
# and aggregated target variable
plt.figure(figsize=(20,5));
plt.subplot(1, 2, 1 );
plt.hist(y1);
plt.xlabel('original target value')
plt.ylabel('count')
plt.subplot(1, 2, 2);
plt.hist(y)
plt.xlabel('aggregated target value')
plt.show()
运行下逻辑回归看看效果如何!
数据缩放前
# Split the data into test and training sets
X_train, X_test, y_train, y_test = train_test_split(X, y, test_size=0.2, random_state=42)
#initial logistic regression model
lr = linear_model.LogisticRegression()
# fit the model
lr = lr.fit(X_train, y_train)
print('Logistic Regression score for training set: %f' % lr.score(X_train, y_train))
from sklearn.metrics import classification_report
y_true, y_pred = y_test, lr.predict(X_test)
print(classification_report(y_true, y_pred))
Logistic Regression score for training set: 0.752932
precision recall f1-score support
False 0.78 0.74 0.76 179
True 0.69 0.74 0.71 141
avg / total 0.74 0.74 0.74 320
数据缩放后
from sklearn.preprocessing import scale
Xs = scale(X)
Xs_train, Xs_test, y_train, y_test = train_test_split(Xs, y, test_size=0.2, random_state=42)
lr_2 = lr.fit(Xs_train, y_train)
print('Scaled Logistic Regression score for test set: %f' % lr_2.score(Xs_test, y_test))
y_true, y_pred = y_test, lr_2.predict(Xs_test)
print(classification_report(y_true, y_pred))
Scaled Logistic Regression score for test set: 0.740625
precision recall f1-score support
False 0.79 0.74 0.76 179
True 0.69 0.74 0.72 141
avg / total 0.74 0.74 0.74 320
使用数据缩放后,逻辑回归的性能并没有提升。为什么会这样,特别是我们看到在k-NN上使用缩放性能大幅提升之后?其原因在于,如果有大范围的预测变量,它们不会影响目标变量,回归算法会将相应的系数ai调小,这样它们就不会对预测有太大影响。k-NN没有这种内置的策略,所以我们需要缩放数据。
缩放数据对模型影响量化分析
使用滋扰变量(不会影响目标变量但会影响模型)形式的噪声来看看它会对缩放前后的模型有何影响,合成一个数据集,在此可以控制滋扰变量的确切性质合成数据噪声越大,缩放对k-NN越重要。
blob产生数据
# Generate some clustered data (blobs!)
import numpy as np
from sklearn.datasets.samples_generator import make_blobs
n_samples=2000
X, y = make_blobs(n_samples, centers=4, n_features=2,
                  random_state=0)
绘制合成数据
%matplotlib inline
import matplotlib.pyplot as plt
plt.style.use('ggplot')
plt.figure(figsize=(20,5));
plt.subplot(1, 2, 1 );
plt.scatter(X[:,0] , X[:,1],  c = y, alpha = 0.7);
plt.subplot(1, 2, 2);
plt.hist(y)
plt.show()
注意:我们可以在第二幅图中看到所有可能的目标变量都均等。在这种情况下(或者它们大致均等),我们说类y是平衡的。
import pandas as pd
df = pd.DataFrame(X)
pd.DataFrame.hist(df, figsize=(20,5));
分割和绘制测试集和训练集
from sklearn.cross_validation import train_test_split
X_train, X_test, y_train, y_test = train_test_split(X, y, test_size=0.2, random_state=42)
plt.figure(figsize=(20,5));
plt.subplot(1, 2, 1 );
plt.title('training set')
plt.scatter(X_train[:,0] , X_train[:,1],  c = y_train, alpha = 0.7);
plt.subplot(1, 2, 2);
plt.scatter(X_test[:,0] , X_test[:,1],  c = y_test, alpha = 0.7);
plt.title('test set')
plt.show()
数据缩放前KNN性能
from sklearn import neighbors, linear_model
knn = neighbors.KNeighborsClassifier()
knn_model = knn.fit(X_train, y_train)
print('k-NN score for test set: %f' % knn_model.score(X_test, y_test))
from sklearn.metrics import classification_report
y_true, y_pred = y_test, knn_model.predict(X_test)
print(classification_report(y_true, y_pred))
k-NN score for test set: 0.935000
precision recall f1-score support
0 0.87 0.90 0.88 106
1 0.98 0.93 0.95 102
2 0.90 0.92 0.91 100
3 1.00 1.00 1.00 92
avg / total 0.94 0.94 0.94 400
缩放数据
from sklearn.preprocessing import scale
Xs = scale(X)
Xs_train, Xs_test, y_train, y_test = train_test_split(Xs, y, test_size=0.2, random_state=42)
plt.figure(figsize=(20,5));
plt.subplot(1, 2, 1 );
plt.scatter(Xs_train[:,0] , Xs_train[:,1],  c = y_train, alpha = 0.7);
plt.title('scaled training set')
plt.subplot(1, 2, 2);
plt.scatter(Xs_test[:,0] , Xs_test[:,1],  c = y_test, alpha = 0.7);
plt.title('scaled test set')
plt.show()
数据缩放后KNN性能
knn_model_s = knn.fit(Xs_train, y_train)
print('k-NN score for test set: %f' % knn_model_s.score(Xs_test, y_test))
from sklearn.metrics import classification_report
y_true, y_pred = y_test, knn_model_s.predict(Xs_test)
print(classification_report(y_true, y_pred))
k-NN score for test set: 0.935000
precision recall f1-score support
0 0.87 0.92 0.89 106
1 0.98 0.92 0.95 102
2 0.91 0.92 0.92 100
3 1.00 0.99 0.99 92
avg / total 0.94 0.94 0.94 400
使用缩放对性能并没有任何改进!这大概是因为所有特征都处于同一范围内。当各种变量范围差别巨大时,缩放才有意义。想看看它的实际作用,我们将会加入另外一个特征。此外,该特征将与目标变量无关:这纯粹是噪声。
在信号中加入噪声
我们加入高斯噪声变量,均值为0,变量标准差为 σ 。我们称 σ 为噪声强度,我们会看到,噪声强度越大,k近邻性能越差。
# Add noise column to predictor variables
ns = 10**(3) # Strength of noise term
newcol = np.transpose([ns*np.random.randn(n_samples)])
Xn = np.concatenate((X, newcol), axis = 1)
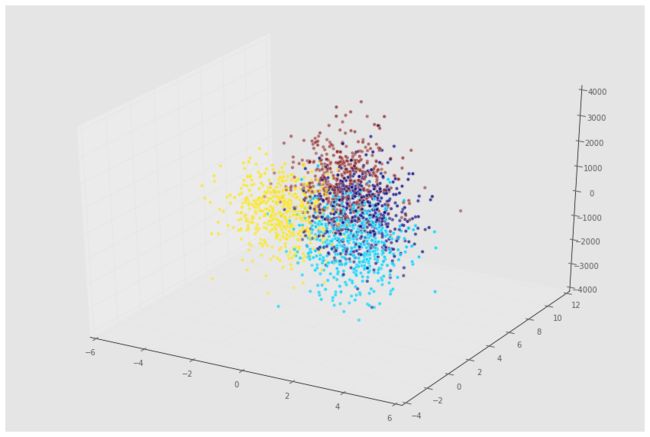
mplot3d包来绘制数据3D图:
from mpl_toolkits.mplot3d import Axes3D
fig = plt.figure(figsize=(15,10));
ax = fig.add_subplot(111, projection='3d' , alpha = 0.5);
ax.scatter(Xn[:,0], Xn[:,1], Xn[:,2], c = y);
加入噪声以后的数据缩放前性能
Xn_train, Xn_test, y_train, y_test = train_test_split(Xn, y, test_size=0.2, random_state=42)
knn = neighbors.KNeighborsClassifier()
knn_model = knn.fit(Xn_train, y_train)
print('k-NN score for test set: %f' % knn_model.score(Xn_test, y_test))
from sklearn.metrics import classification_report
y_true, y_pred = y_test, knn_model.predict(Xn_test)
print(classification_report(y_true, y_pred))
k-NN score for test set: 0.397500
precision recall f1-score support
0 0.31 0.44 0.37 106
1 0.45 0.38 0.41 102
2 0.43 0.44 0.44 100
3 0.48 0.32 0.38 92
avg / total 0.42 0.40 0.40 400
加入噪声以后的数据缩放后性能
Xns = scale(Xn)
s = int(.2*n_samples)
Xns_train = Xns[s:]
y_train = y[s:]
Xns_test = Xns[:s]
y_test = y[:s]
knn = neighbors.KNeighborsClassifier()
knn_models = knn.fit(Xns_train, y_train)
print('k-NN score for test set: %f' % knn_models.score(Xns_test, y_test))
from sklearn.metrics import classification_report
y_true, y_pred = y_test, knn_models.predict(Xns_test)
print(classification_report(y_true, y_pred))
k-NN score for test set: 0.937500
precision recall f1-score support
0 0.85 0.93 0.89 87
1 0.97 0.95 0.96 103
2 0.93 0.91 0.92 110
3 1.00 0.96 0.98 100
avg / total 0.94 0.94 0.94 400
缩放数据之后,模型的性能与加入噪声之前差的很多。
噪声越大,问题越大
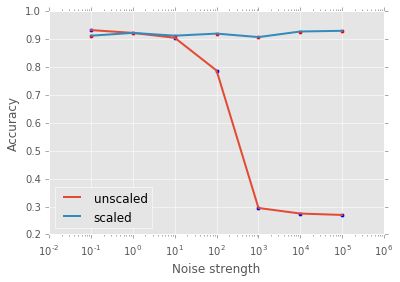
现在我们使用噪声强度函数来看看模型性能的变化。
在KNN上测试
def accu( X, y):
    X_train, X_test, y_train, y_test = train_test_split(X, y, test_size=0.2, random_state=42)
    knn = neighbors.KNeighborsClassifier()
    knn_model = knn.fit(X_train, y_train)
    return(knn_model.score(X_test, y_test))
noise = [10**i for i in np.arange(-1,6)]
A1 = np.zeros(len(noise))
A2 = np.zeros(len(noise))
count = 0
for ns in noise:
newcol = np.transpose([ns*np.random.randn(n_samples)])
Xn = np.concatenate((X, newcol), axis = 1)
Xns = scale(Xn)
A1[count] = accu( Xn, y)
A2[count] = accu( Xns, y)
count += 1plt.scatter( noise, A1 )
plt.plot( noise, A1, label = 'unscaled', linewidth = 2)
plt.scatter( noise, A2 , c = 'r')
plt.plot( noise, A2 , label = 'scaled', linewidth = 2)
plt.xscale('log')
plt.xlabel('Noise strength')
plt.ylabel('Accuracy')
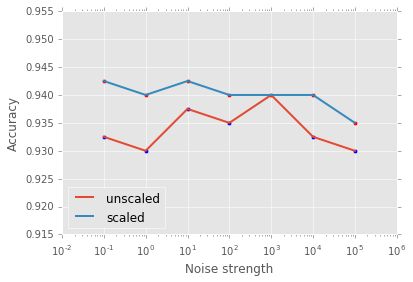
plt.legend(loc=3);滋扰变量中噪声越多,在k-NN模型中缩放数据就越重要。
在LR上测试
def accu( X, y):
X_train, X_test, y_train, y_test = train_test_split(X, y, test_size=0.2, random_state=42)
lr = linear_model.LogisticRegression()
lr_model = lr.fit(X_train, y_train)
return(lr_model.score(X_test, y_test))
noise = [10**i for i in np.arange(-1,6)]
A1 = np.zeros(len(noise))
A2 = np.zeros(len(noise))
count = 0
for ns in noise:
    newcol = np.transpose([ns*np.random.randn(n_samples)])
    Xn = np.concatenate((X, newcol), axis = 1)
    Xns = scale(Xn)
    A1[count] = accu( Xn, y)
    A2[count] = accu( Xns, y)
    count += 1
plt.scatter( noise, A1 )
plt.plot( noise, A1, label = 'unscaled', linewidth = 2)
plt.scatter( noise, A2 , c = 'r')
plt.plot( noise, A2 , label = 'scaled', linewidth = 2)
plt.xscale('log')
plt.xlabel('Noise strength')
plt.ylabel('Accuracy')
plt.legend(loc=3);在逻辑回归中,缩放对噪声影响不大
