Python NetworkX +Gephi利用PageRank和K-Clique分析并可视化社会网络
在柯布伦兹兰道大学社交网络数据集网页下载数据集Physicians,地址:http://konect.uni-koblenz.de/networks/moreno_innovation
数据集简介:This directed network captures innovation spread among 246 physicians in for towns in Illinois, Peoria, Bloomington, Quincy and Galesburg. The data was collected in 1966. A node represents a physician and an edge between two physicians shows that the left physician told that the righ physician is his friend or that he turns to the right physician if he needs advice or is interested in a discussion. There always only exists one edge between two nodes even if more than one of the listed conditions are true.
大概意思是:这是一个包含有246个医师分布在4个城镇的有向社交网络
先导入即将用到的包
import matplotlib.pyplot as plt
import os
import networkx as nx
import pandas as pd
import numpy as np
from networkx.algorithms.community import k_clique_communities
该数据集为有向图,创建一个有向图并导入数据,规范的数据集产生后即可调用Full PageRank算法,设定damping parameter alpha α=0.85
os.chdir('.\\')
filename = 'physician.txt'
G=nx.DiGraph()
with open(filename) as file:
    for line in file:
        head, tail = [int(x) for x in line.split()]
        G.add_edge(head,tail)

pr=nx.pagerank(G,alpha=0.85)
PageRank以字典的形式返回出来,后面可以用NetworkX的绘图工具简单做个可视化
layout = nx.spring_layout(G)
plt.figure(1)
nx.draw(G, pos=layout, node_color='y', node_size=30)

#添加标签
plt.figure(2)
nx.draw(G, pos=layout, node_size=[i * 6000 for i in pr.values()],node_color='g',with_labels=True)
得出两幅图
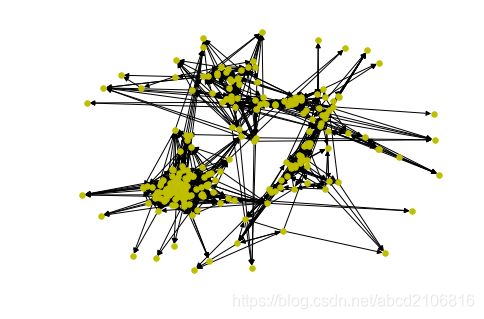

效果不是很好,后面用Gephi进行可视化。现在先调用NetworkX的算法包,使用K-Clique进行社区探测,K-Clique支持无向图,那么把原数据的有向图转变为无向图即可(需要注意的是无向图是不能轻易转化为有向图,而有向图能够转化为无向图)
#from networkx.algorithms.community import k_clique_communities
def find_community(graph,k):
    return list(k_clique_communities(graph,k))

G2 = nx.Graph()
with open(filename) as file:
    for line in file:
        head, tail = [int(x) for x in line.split()]
        G2.add_edge(head,tail)

for k in range(5,10):
        print ("############# k-Clique: %d ################" % k)
        rst_com = find_community(G2,k)
        print ("Count of Community being found:%d" % len(rst_com))
        print(rst_com)
打印的结果为
############# k-Clique: 5 ################
Count of Community being found:7
[frozenset({18, 74, 13, 14, 15}), frozenset({37, 54, 23, 40, 15}), frozenset({20, 117, 21, 25, 95}), frozenset({128, 129, 132, 121, 127}), frozenset({132, 121, 125, 142, 127}), frozenset({194, 179, 197, 168, 203}), frozenset({207, 208, 209, 210, 211, 216, 217, 219, 220, 221, 223, 224, 225, 226, 227, 228})]
############# k-Clique: 6 ################
Count of Community being found:1
[frozenset({225, 228, 208, 209, 210, 216, 217, 220, 221})]
############# k-Clique: 7 ################
Count of Community being found:1
[frozenset({208, 225, 209, 210, 228, 220, 221})]
############# k-Clique: 8 ################
Count of Community being found:0
[]
############# k-Clique: 9 ################
Count of Community being found:0
[]
可以看到当k为5,6,7的时候是能够探测出各个社区的,当k大于7时就找不到符合条件的社区。
针对NetworkX可视化效果不太好,这里使用Gephi进行可视化,当然Gephi有很多功能,也包括PageRank等网络中心度的计算,还有社区探测,聚类系数等等。这里操作步骤:
- 设置布局算法Force Atlas(最常见的算法之一)
- 计算模块化,以探测社区,解析度设为2.0
- 计算PageRank
- 根据模块化侦测的社区进行颜色分类
- 根据PageRank进行大小的Ranking
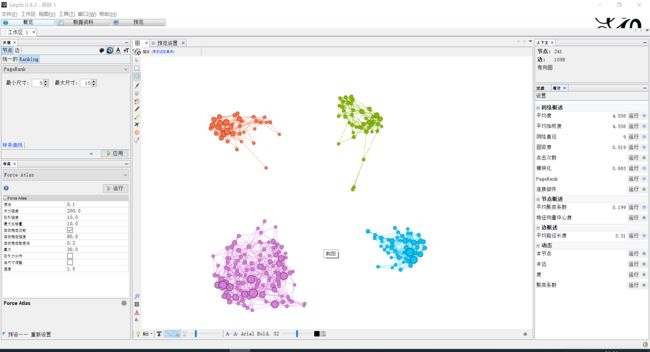
这里能够清晰的看出4个城镇的医师都以本城镇的医师网络关系为主,没有一个医师有进行跨城镇交际,粉色城镇的网络最大,绿色城镇的网络最小,且绿色城镇内医师间的交际情况较差。在下表的数据也能支持这个结论