解决python中cannot import name 'Bar' from 'pyecharts'问题
最近在学习pyecharts的时候,遇到了点问题,因为网上的解决办法五花八门还不能让我的代码彻底运行完,我这里就遇到的问题,说一下我的解决方式。
1、首先,先保证自己已经安装了pyecharts,没有安装的话请:
win+R,运行cmd,然后键入pip install pyecharts,完成pyecharts的安装
2、因为pyecharts的版本更新问题,现在已经不能写成
from pyecharts import Bar需要改调用方法,应写成:
from pyecharts.charts import Bar此时就可以解决上面的问题了
3、但是这个时候虽然可以正常调用了,但是网上的一些方法如:bar=Bar("各商场销售情况"),会报错:'str' object has no attribute 'get',这里我猜也是因为版本更新了的问题,不能这么玩了,所以一整套就都要变了
from pyecharts.charts import Bar
from pyecharts import options as opts

bar = Bar()
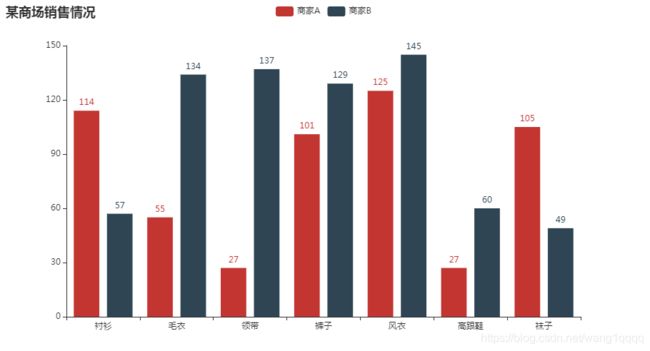
bar.add_xaxis(["衬衫", "毛衣", "领带", "裤子", "风衣", "高跟鞋", "袜子"])
bar.add_yaxis("商家A", [114, 55, 27, 101, 125, 27, 105])
bar.add_yaxis("商家B", [57, 134, 137, 129, 145, 60, 49])
bar.set_global_opts(title_opts=opts.TitleOpts(title="某商场销售情况"))
bar.render()
此时就会在你的workspace中出现一个render的html,打开他就是你做出来的可视化报表了。
更多的可视化报表的应用方式和参考代码,大家可以参考:https://github.com/pyecharts/pyecharts
因为是生成一个文件,美中不足的是不会自己打开这个html,所以此时如果想要运行后自动打开这个html,我就稍微加工一下:
from pyecharts.charts import Bar
from pyecharts import options as opts
import os

bar = Bar()
bar.add_xaxis(["衬衫", "毛衣", "领带", "裤子", "风衣", "高跟鞋", "袜子"])
bar.add_yaxis("商家A", [114, 55, 27, 101, 125, 27, 105])
bar.add_yaxis("商家B", [57, 134, 137, 129, 145, 60, 49])
bar.set_global_opts(title_opts=opts.TitleOpts(title="某商场销售情况"))
bar.render()

os.system("render.html")
此时就可以在运行改python文件后,自动在浏览器中打开这个可视化报表了
