import numpy as np
import pandas as pd
import matplotlib.pyplot as plt
import matplotlib as mpl
import seaborn as sn
from pylab import *
mpl.rcParams['font.sans-serif']=['SimHei']
from pyecharts.charts import Map
from pyecharts import options as opts
data = pd.read_excel("全国高等学校名单.xls")
data=data.drop(['备注'],axis=1)
data_beijing=data[(data['所在地']=='北京市')&(data['办学层次']=='本科')]
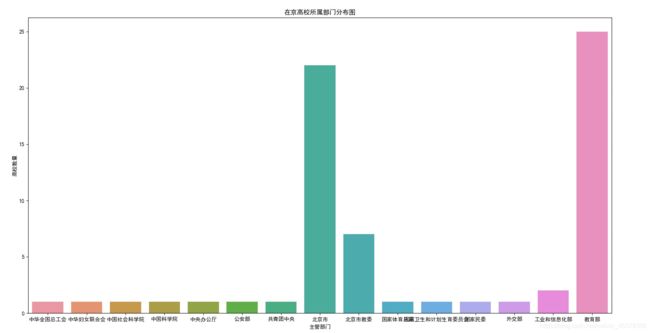
data_beijing_department=data_beijing.groupby('主管部门').size().reset_index()
fig,axes=plt.subplots()
fig.set_size_inches(20,12)
sn.barplot(data=data_beijing_department,x="主管部门",y=0)
axes.set(xlabel='主管部门',ylabel='高校数量',title='在京高校所属部门分布图')
plt.savefig("在京高校所属部门分布图.png")
plt.show()
data_university=data[data['办学层次']=='本科']
data_university=data_university.groupby('所在地(省)').size().reset_index()
provinces=list(data_university['所在地(省)'])
values=list(data_university.iloc[:,1])
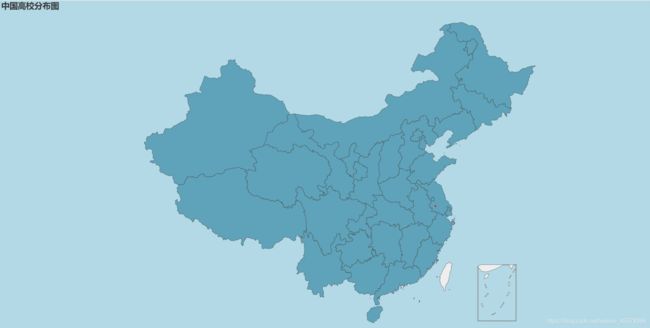
map = Map(init_opts=opts.InitOpts(width="1900px", height="900px", bg_color="#ADD8E6",
page_title="中国高校分布图",theme="white"))
map.add("数量:",[list(z) for z in zip(provinces,values)],is_map_symbol_show=False,
maptype="china",label_opts=opts.LabelOpts(is_show=False),
itemstyle_opts=opts.ItemStyleOpts(color="rgb(49,60,72)"))
map.set_global_opts(title_opts = opts.TitleOpts(title='中国高校分布图'),
legend_opts=opts.LegendOpts(is_show=False),
visualmap_opts = opts.VisualMapOpts(max_=100000))
map.render(path='中国高校分布图1.html')
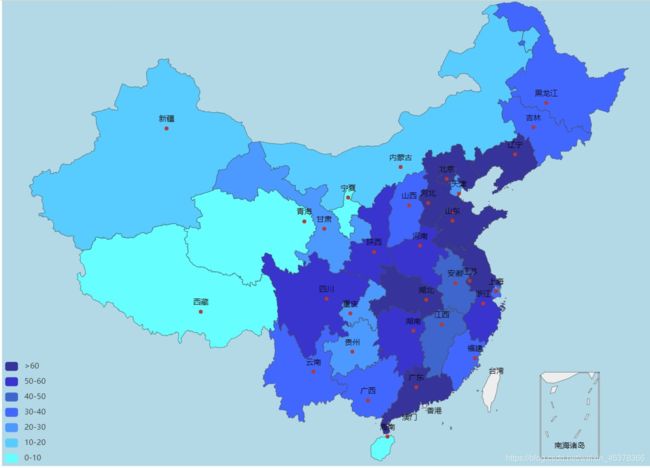
map = Map(init_opts=opts.InitOpts(width="1900px", height="900px", bg_color="#ADD8E6",
page_title="中国高校分布图",theme="white"))
map.set_global_opts(
title_opts=opts.TitleOpts(title="中国高校分布图"),
visualmap_opts=opts.VisualMapOpts(max_=100000, is_piecewise=True,
pieces=[
{"max": 100, "min": 61, "label": ">60", "color": "#333399"},
{"max": 60, "min": 51, "label": "50-60", "color": "#3333CC"},
{"max": 50, "min": 41, "label": "40-50", "color": "#3366CC"},
{"max": 40, "min": 31, "label": "30-40", "color": "#3366FF"},
{"max": 30, "min": 21, "label": "20-30", "color": "#3399FF"},
{"max": 20, "min": 11, "label": "10-20", "color": "#33CCFF"},
{"max": 10, "min": 0, "label": "0-10", "color": "#33FFFF"},
], )
)
map.add("中国高校分布图", data_pair=[list(z) for z in zip(provinces,values)], maptype="china", label_opts=opts.LabelOpts(is_show=True),is_roam=True)
map.render('中国高校分布图2.html')


