Angular项目中使用echarts中国地图
首先要在Angular项目中安装echarts的依赖:
npm  install  echarts  --save
npm  install  ngx-echarts  --save
第二、在创建包含地图的Angular组件的时候引入echarts插件和包含的地图插件,并完成配置和初始化。主要有两种方式:
第一种方式,通过JSON方式引入,步骤如下:
(1)引入httpClient和NgxEchartsService服务,并依赖注入对应组件。
import {HttpClient} from '@angular/common/http';
import {NgxEchartsService} from 'ngx-echarts';


constructor(private http: HttpClient,
              private nes: NgxEchartsService,
              private draw: DrawService
  ) { }
另外记得在组件对应的模块配置文件中添加HttpClientModule和NgxEchartsModule模块;
(2)配置地图参数信息,具体配置信息可查询echarts官网配置项内容自行配置。该demo配置项对象代码如下:
setMapOption() {
    this.mapOption = {
      title : {
        text: '中移在线通信云项目实时监控',
        subtext: '',
        left: 'center',
        textStyle: {
          color: '#333',
          fontSize: '28',
        },
      },
      backgroundColor: '#96aec7',
      tooltip : {
        trigger: 'item',
        formatter: function (val) {
          return `项目进度:
${val.data.name}:${val.data.value}%
告警:${val.data.warn}
问题:${val.data.problem}`;
        }
      },
      legend: {
        orient: 'vertical',
        left: 'left',
        data:[]
      },
      visualMap: {
        min: 0,
        max: 100,
        left: 'left',
        top: 'bottom',
        text:['高','低'],           // 文本,默认为数值文本
        calculable : true,
        inRange: {
          color: ['#feffc7', '#02cb00']
        }
      },
      series : [
        {
          name: '项目进度',
          type: 'map',
          mapType: 'china',
          roam: false,
          label: {
            normal: {
              show: true
            },
            emphasis: {
              show: true
            }
          },
          itemStyle: {
            color: 'red',
            areaColor: '#fff',
          },
          emphasis: {
            itemStyle: {
              areaColor: '#f9ba09'
            }
          },
          data:[
            {name: '北京',value: Math.round(Math.random()*100),warn: 10,problem: 12},
            {name: '天津',value: Math.round(Math.random()*100),warn: 10,problem: 12},
            {name: '上海',value: Math.round(Math.random()*100),warn: 10,problem: 12},
            {name: '重庆',value: Math.round(Math.random()*100),warn: 10,problem: 12},
            {name: '河北',value: Math.round(Math.random()*100)},
            {name: '河南',value: Math.round(Math.random()*100)},
            {name: '云南',value: Math.round(Math.random()*100)},
            {name: '辽宁',value: Math.round(Math.random()*100)},
            {name: '黑龙江',value: Math.round(Math.random()*100)},
            {name: '湖南',value: Math.round(Math.random()*100)},
            {name: '安徽',value: Math.round(Math.random()*100)},
            {name: '山东',value: Math.round(Math.random()*100)},
            {name: '新疆',value: Math.round(Math.random()*100)},
            {name: '江苏',value: Math.round(Math.random()*100)},
            {name: '浙江',value: Math.round(Math.random()*100)},
            {name: '江西',value: Math.round(Math.random()*100)},
            {name: '湖北',value: Math.round(Math.random()*100)},
            {name: '广西',value: Math.round(Math.random()*100)},
            {name: '甘肃',value: Math.round(Math.random()*100)},
            {name: '山西',value: Math.round(Math.random()*100)},
            {name: '内蒙古',value: Math.round(Math.random()*100)},
            {name: '陕西',value: Math.round(Math.random()*100)},
            {name: '吉林',value: Math.round(Math.random()*100)},
            {name: '福建',value: Math.round(Math.random()*100)},
            {name: '贵州',value: Math.round(Math.random()*100)},
            {name: '广东',value: Math.round(Math.random()*100)},
            {name: '青海',value: Math.round(Math.random()*100)},
            {name: '西藏',value: Math.round(Math.random()*100)},
            {name: '四川',value: Math.round(Math.random()*100)},
            {name: '宁夏',value: Math.round(Math.random()*100)},
            {name: '海南',value: Math.round(Math.random()*100)},
            // {name: '台湾',value: Math.round(Math.random()*100)},
            {name: '香港',value: Math.round(Math.random()*100)},
            {name: '澳门',value: Math.round(Math.random()*100)}
          ]
        }
      ]
    };
  }
(3)使用http服务获取china.json,在对应的回调函数中初始化地图,代码如下:
@ViewChild('chartMap') chartMap: ElementRef; // 获取DOM节点的对象
initEcharts() {
     this.http.get('assets/json/china.json').subscribe(res => {
      const echart = this.echarts.init(this.chartMap.nativeElement); // 获取视图的echarts的DOM节点,并初始化对象
      this.echarts.registerMap('china', res); // 注册china.json的数据到初始化的echarts对象
      echart.setOption(this.mapOption); // 绑定地图的配置参数对象,参考第二步
      echart.on('click', function(params) { // 绑定地图点击事件
        // console.log(params);
      }.bind(this));
    });
}(4)在组件初始化方法中调用echarts初始化方法,这个地方有个设置地图dom固定宽高的方法,可根据页面宽度自适应地图的高度,如果不设置高度,echarts图表无法显示:
ngOnInit() {
    this.setChartStyle(); // 设置地图固定宽高比的方法
    this.setMapOption();  // 配置map地图参数信息方法
    this.initEcharts();  // 初始化地图
}

setChartStyle() {
    const width = this.chartMap.nativeElement.offsetWidth;
    this.chartMap.nativeElement.style.height = width * 0.4 + 'px';
}
第二种方式,通过china.js引入的方式,该方式可不引入NgxEchartsService,步骤跟第一种类似,如下:
(1)引入china.js和echarts组件,此处不需要注入其他服务,代码如下:
import 'echarts/map/js/china.js';
import * as echarts from 'echarts';
同样在组件对应的模块配置文件中添加HttpClientModule和NgxEchartsModule模块;
(2)配置地图信息同第一种方法。
(3)初始化地图方法,代码如下:
const echart = echarts.init(this.chartMap.nativeElement); // 获取视图的echarts的DOM节点,并初始化对象
    echart.setOption(this.mapOption); // 绑定地图的配置参数对象
    echart.on('click', function(params) {
      console.log(params);
    }.bind(this));
(4)在组件的初始化方法中初始化地图,代码同第一种方法(4)。
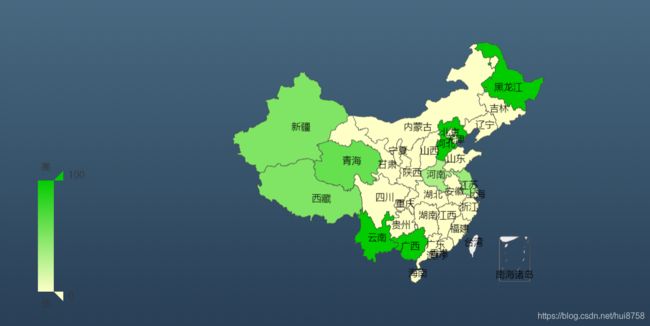
效果图如下所示:
