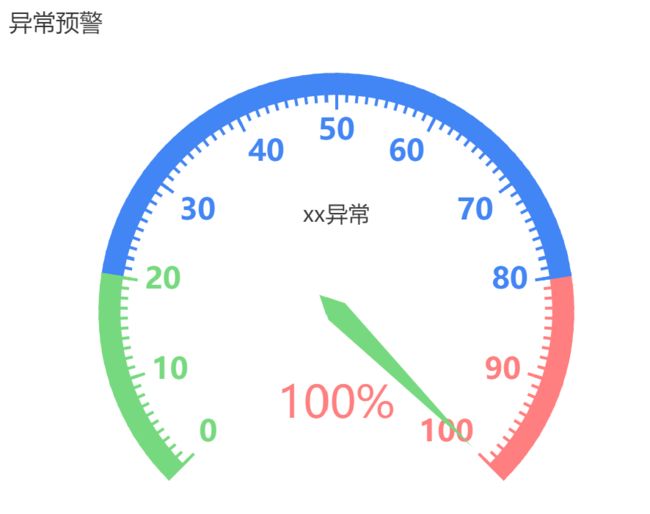
ECharts自定义仪表盘
实现效果

源代码
html代码
common.js代码
$(function () {
	/*
		0.使用echars的初始化操作
	*/
	var sealWarnningGauge = echarts.init(document.getElementById('seal_warning_gauge'));
	/*
		1.异常预警仪表盘
	*/
	option1 = {
	    title: [{
	        x:'17',
	        top: '21',
	        text: '异常预警',
	        textStyle: {
	            fontWeight: 'normal',
	            fontSize: '16',
	            color: "#333"
	        },
	    }],
    	series : [{
            name:'xx异常',
            type:'gauge',
            min:0,
            max:100,
            center: ['50%', '60%'], // 默认全局居中
            radius: '85%',
            axisLine: {            // 坐标轴线
                lineStyle: {       // 属性lineStyle控制线条样式
                    color: [[0.2, '#77D97F'],[0.8, '#4285F4'],[1, '#FF7E7F']],
                    width: 15,
                    shadowColor : '#fff', //默认透明
                }
            },
            axisLabel: {            // 坐标轴小标记
                textStyle: {       // 属性lineStyle控制线条样式
                    fontWeight: 'bolder',
                    fontSize:20,
                },

            },
            axisTick: {            // 仪表盘的线条
                length :20,        // 属性length控制线长
                lineStyle: {       // 属性lineStyle控制线条样式
                    color: 'auto',
                    width:2,
                },
                splitNumber: 10,
            },
            splitLine:{
                //最长的刻度线
                length:25,
                lineStyle:{
                    color: 'auto',
                }
            },
            itemStyle:{//指针颜色
                color:'#77D97F',
            },
            pointer:{//指针长短
                length:130
            },
            detail: {
                formatter:'{value}%',
            },
            data:[{value: '100', name: 'xx异常'}]
	        }
	    ]
	};

	sealWarnningGauge.setOption(option1, true);
 	//图表自适应
	window.onresize = function () {
	    option1.resize();
	};