ML - sklearn实现 PCA主成分分析
原文:principal component analysis with scikit-learn by Niraj Verma. (有删改)
kaggle项目Crowdedness at the Campus Gym(附data.csv下载)
PCA的一般步骤
- 数据标准化/中心化(数据减去均值)
- 通过协方差矩阵 or 相关系数矩阵,得到特征值和特征向量
- 从大到小排列特征值,并按需选择前k个特征值(k < 字段的个数)和对应的特征向量
- 利用选出的k个特征向量构造出转换矩阵W(即投影变换的/线性变换的比例数据矩阵)
- 利用转换矩阵,对原始数据集的X进行投影,得到用k个PC表示的原始数据集的X部分(即用k个PC代替换数据集的n个字段/feature)。
项目要求和说明:
背景
什么时候我大学体育馆的人最少,我正好去锻炼?数据方面,在去年开>始,我们每隔10分钟记录一次体育馆里的人数。我们还想预测未来的体育馆拥挤度。
目标
- 指定一个时间(也许是其他的,像天气),预测体育馆的拥挤度。
- 找出哪些因素对此影响最重要,哪些可以忽略,还有是否可以填加一些因素把预测结果变得更准。
数据
数据集来自于去年(大约每隔10分钟)采集的体育馆人数,共计26000。此外,我还搜集了像天气、学期等等可能影响拥挤度的信息。我想要预测的是“人数”字段。
被预测字段:
- lable
预测字段:- date:string,时间的datetime类型
- timestamp:int,当天的按秒计算的时间戳
- day_of_week:int,0[星期一] ~ 6[星期日]
- is_weekend:int,1表示周末,0表示非周末
- is_holiday:int,1表示假期,0表示非假期
- temperature:float,华氏温度
- is_start_of_semester:int,1表示是学期初,0不是
- month:int,1~12代表12个月
- hour:int,1~23代表一天的24小时
致谢
经学校和体育馆的同意,才收集了这些数据。
我将用Scikit-learn通过最大离散度找出所有的成分,并分离出主成分。
- 第一,对原始数据标准化,
"""先检查一下`data.csv`的数据类型等信息:"""
import pandas as pd

df = pd.read_csv('path+data.csv', low_memory=False)

print(df.info)
# 结果如下
<class 'pandas.core.frame.DataFrame'>
RangeIndex: 62184 entries, 0 to 62183
Data columns (total 11 columns):
number_people           62184 non-null int64
date                    62184 non-null object
timestamp               62184 non-null int64
day_of_week             62184 non-null int64
is_weekend              62184 non-null int64
is_holiday              62184 non-null int64
temperature             62184 non-null float64
is_start_of_semester    62184 non-null int64
is_during_semester      62184 non-null int64
month                   62184 non-null int64
hour                    62184 non-null int64
dtypes: float64(1), int64(9), object(1)
memory usage: 5.2+ MB

print(df.describe())
# 结果如下:
       number_people     timestamp   day_of_week    is_weekend    is_holiday   temperature  is_start_of_semester  is_during_semester         month          hour  temperature_celsius
count   62184.000000  62184.000000  62184.000000  62184.000000  62184.000000  62184.000000          62184.000000        62184.000000  62184.000000  62184.000000         62184.000000
mean       29.072543  45799.437958      2.982504      0.282870      0.002573     58.557108              0.078831            0.660218      7.439824     12.236460            14.753949
std        22.689026  24211.275891      1.996825      0.450398      0.050660      6.316396              0.269476            0.473639      3.445069      6.717631             3.509109
min         0.000000      0.000000      0.000000      0.000000      0.000000     38.140000              0.000000            0.000000      1.000000      0.000000             3.411111
25%         9.000000  26624.000000      1.000000      0.000000      0.000000     55.000000              0.000000            0.000000      5.000000      7.000000            12.777778
50%        28.000000  46522.500000      3.000000      0.000000      0.000000     58.340000              0.000000            1.000000      8.000000     12.000000            14.633333
75%        43.000000  66612.000000      5.000000      1.000000      0.000000     62.280000              0.000000            1.000000     10.000000     18.000000            16.822222
max       145.000000  86399.000000      6.000000      1.000000      1.000000     87.170000              1.000000            1.000000     12.000000     23.000000            30.650000
"""PCA适用于变量间有相关性的情况,相关性越高,起到的降维作用越好。"""
print(df.corr())
# 结果如下:
                       number_people  timestamp  day_of_week  is_weekend  is_holiday  temperature  is_start_of_semester  is_during_semester     month      hour  temperature_celsius
number_people              1.000000   0.550218    -0.162062   -0.173958   -0.048249     0.373327              0.182683            0.335350 -0.097854  0.552049             0.373327
timestamp                  0.550218   1.000000    -0.001793   -0.000509    0.002851     0.184849              0.009551            0.044676 -0.023221  0.999077             0.184849
day_of_week               -0.162062  -0.001793     1.000000    0.791338   -0.075862     0.011169             -0.011782           -0.004824  0.015559 -0.001914             0.011169
is_weekend                -0.173958  -0.000509     0.791338    1.000000   -0.031899     0.020673             -0.016646           -0.036127  0.008462 -0.000517             0.020673
is_holiday                -0.048249   0.002851    -0.075862   -0.031899    1.000000    -0.088527             -0.014858           -0.070798 -0.094942  0.002843            -0.088527
temperature                0.373327   0.184849     0.011169    0.020673   -0.088527     1.000000              0.093242            0.152476  0.063125  0.185121             1.000000
is_start_of_semester       0.182683   0.009551    -0.011782   -0.016646   -0.014858     0.093242              1.000000            0.209862 -0.137160  0.010091             0.093242
is_during_semester         0.335350   0.044676    -0.004824   -0.036127   -0.070798     0.152476              0.209862            1.000000  0.096556  0.045581             0.152476
month                     -0.097854  -0.023221     0.015559    0.008462   -0.094942     0.063125             -0.137160            0.096556  1.000000 -0.023624             0.063125
hour                       0.552049   0.999077    -0.001914   -0.000517    0.002843     0.185121              0.010091            0.045581 -0.023624  1.000000             0.185121
temperature_celsius        0.373327   0.184849     0.011169    0.020673   -0.088527     1.000000              0.093242            0.152476  0.063125  0.185121             1.000000
"""数据标准化"""
df.drop(['date'], axis=1, inplace=True)          # 把object类型的字段删去
df['temperature_celsius'] = (df['temperature'] - 32)*5/9
X = df.iloc[:, 1:]
Y = df.iloc[:, 0]

from sklearn.preprocessing import StandardScaler as ss
X_z = ss().fit_transform(X)
print(X_z)
# 结果如下
[[ 0.63654993  0.50956119 -0.6280507  ...  0.16260365  0.70911589
   2.09027384]
 [ 0.68623792  0.50956119 -0.6280507  ...  0.16260365  0.70911589
   2.09027384]
 [ 0.71106127  0.50956119 -0.6280507  ...  0.16260365  0.70911589
   2.09027384]
 ...
 [ 0.94008862  1.01036016  1.59222814 ... -1.28875789  1.0068423
  -0.292433  ]
 [ 0.96515979  1.01036016  1.59222814 ... -1.28875789  1.0068423
  -0.292433  ]
 [ 0.99010704  1.01036016  1.59222814 ... -1.28875789  1.0068423
  -0.292433  ]]

from sklearn.decomposition import PCA
pca = PCA()
X_pca = pca.fit_transform(X_z)         # 得到的PCA结果,第1列(不是第一个list)是PC1...第N列是PCN。
print(X_pca)
# 结果如下
[[-2.52371919e+00 -1.02165587e-01 -7.65529294e-01 ...  8.72699113e-01
  -5.23663858e-02  3.40296358e-15]
 [-2.54686265e+00 -9.57848184e-02 -7.40213044e-01 ...  8.72687573e-01
  -1.72331263e-02 -1.29498448e-15]
 [-2.55842476e+00 -9.25970864e-02 -7.27565441e-01 ...  8.72681808e-01
   3.18901020e-04  1.98657875e-17]
 ...
 [-7.12791225e-01 -1.42032095e+00  1.68688247e+00 ... -4.38148124e-01
  -4.63899475e-02  3.32313751e-16]
 [-7.24468765e-01 -1.41710139e+00  1.69965634e+00 ... -4.38153947e-01
  -2.86626919e-02  2.53854488e-16]
 [-7.36088590e-01 -1.41389775e+00  1.71236707e+00 ... -4.38159741e-01
  -1.10230504e-02  2.53899624e-16]]
- 第二,获得各个特征值,得到各个主成分的贡献率:
"""特征值和特诊向量都是通过“协方差矩阵” / “相关系数矩阵”得来的。"""
# 特征向量/PC
X_cov = pca.get_covariance()
print(X_cov)
# 结果如下
[[ 1.00001608e+00 -1.79321968e-03 -5.08815704e-04  2.85078360e-03
   1.84852463e-01  9.55105884e-03  4.46766172e-02 -2.32214497e-02
   9.99093506e-01  1.84852463e-01]
 [-1.79321968e-03  1.00001608e+00  7.91350923e-01 -7.58632581e-02
   1.11689106e-02 -1.17822146e-02 -4.82370614e-03  1.55589363e-02
  -1.91430511e-03  1.11689106e-02]
 [-5.08815704e-04  7.91350923e-01  1.00001608e+00 -3.18993471e-02
   2.06736733e-02 -1.66460432e-02 -3.61277725e-02  8.46248251e-03
  -5.17297084e-04  2.06736733e-02]
 [ 2.85078360e-03 -7.58632581e-02 -3.18993471e-02  1.00001608e+00
  -8.85280154e-02 -1.48581472e-02 -7.07995743e-02 -9.49438154e-02
   2.84321058e-03 -8.85280154e-02]
 [ 1.84852463e-01  1.11689106e-02  2.06736733e-02 -8.85280154e-02
   1.00001608e+00  9.32433629e-02  1.52478347e-01  6.31255958e-02
   1.85123709e-01  1.00001608e+00]
 [ 9.55105884e-03 -1.17822146e-02 -1.66460432e-02 -1.48581472e-02
   9.32433629e-02  1.00001608e+00  2.09865473e-01 -1.37161817e-01
   1.00908854e-02  9.32433629e-02]
 [ 4.46766172e-02 -4.82370614e-03 -3.61277725e-02 -7.07995743e-02
   1.52478347e-01  2.09865473e-01  1.00001608e+00  9.65572296e-02
   4.55815903e-02  1.52478347e-01]
 [-2.32214497e-02  1.55589363e-02  8.46248251e-03 -9.49438154e-02
   6.31255958e-02 -1.37161817e-01  9.65572296e-02  1.00001608e+00
  -2.36238823e-02  6.31255958e-02]
 [ 9.99093506e-01 -1.91430511e-03 -5.17297084e-04  2.84321058e-03
   1.85123709e-01  1.00908854e-02  4.55815903e-02 -2.36238823e-02
   1.00001608e+00  1.85123709e-01]
 [ 1.84852463e-01  1.11689106e-02  2.06736733e-02 -8.85280154e-02
   1.00001608e+00  9.32433629e-02  1.52478347e-01  6.31255958e-02
   1.85123709e-01  1.00001608e+00]]
# 各个主成分的贡献率
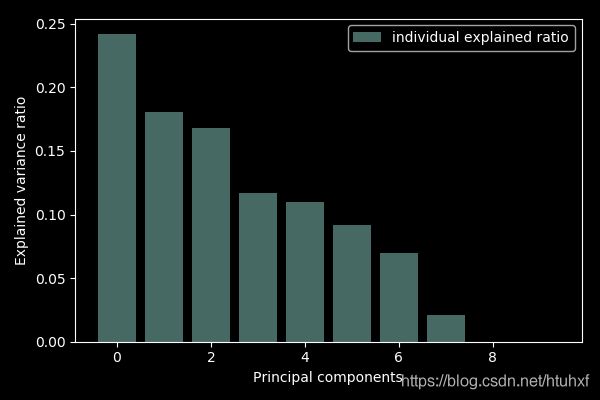
exp_var_ratio = pca.explained_variance_ratio_         # 特征根由`pca.explained_variance_` 得到。
print( exp_var_ratio)                                 # = 特征根/(∑特征根),由大到小排列
# 结果如下
[2.42036778e-01 1.80603471e-01 1.68435608e-01 1.17166687e-01
 1.09788190e-01 9.15207736e-02 6.96821472e-02 2.06741500e-02
 9.21953788e-05 7.50897755e-33]


import matplotlib.pyplot as plt                                   # 把PC贡献率可视化
with plt.style.context('dark_background'):
    plt.figure(figsize=(6, 4))
    plt.bar(range(10), exp_var_ratio, alpha=0.5, label='individual explained ratio')
    plt.ylabel('Explained variance ratio')
    plt.xlabel('Principal components')
    plt.legend(loc='best')
    plt.tight_layout()
    plt.show()
由以上数据图表可知:前5项PC累计贡献了样本81.8%的数据variance,已经高于80%。因此,取前5项为所需主成分,即pca = PCA(n_components=5)。
pca = PCA(n_components=5)
X_pca = pca.fit_transform(X_z)
print(X_pca)
# 结果如下
 [[-2.52371919 -0.10216559 -0.76552929 -1.22396235  1.53217624]
 [-2.54686265 -0.09578482 -0.74021304 -1.22400732  1.52823602]
 [-2.55842476 -0.09259709 -0.72756544 -1.22402979  1.52626755]
 ...
 [-0.71279123 -1.42032095  1.68688247  0.91645937  0.06458138]
 [-0.72446876 -1.41710139  1.69965634  0.91643668  0.06259325]
 [-0.73608859 -1.41389775  1.71236707  0.91641411  0.06061496]]

exp_var_ratio = pca.explained_variance_ratio_
print(exp_var_ratio)
# 结果如下
 [0.24203678 0.18060347 0.16843561 0.11716669 0.10978819]

X_cov = pca.get_covariance()
print(X_cov)
# 结果如下
 [[ 1.18126450e+00 -1.58275818e-03 -2.66182121e-04  5.27615806e-03
   1.84892362e-01  3.93229836e-03  5.12023262e-02 -2.61721115e-02
   8.17340026e-01  1.84892362e-01]
 [-1.58275818e-03  1.07770228e+00  7.11588443e-01 -8.82475845e-02
   1.21242313e-02 -6.43007283e-03 -1.94010854e-02  1.01818019e-02
  -1.63729687e-03  1.21242313e-02]
 [-2.66182121e-04  7.11588443e-01  1.07565931e+00 -6.72583698e-02
   1.99851577e-02 -1.69306859e-02 -4.52216206e-02 -8.91957017e-03
  -3.35532272e-04  1.99851577e-02]
 [ 5.27615806e-03 -8.82475845e-02 -6.72583698e-02  6.26235805e-01
  -8.61955745e-02 -3.79245924e-03 -2.28998452e-01 -2.94481045e-01
   5.20774477e-03 -8.61955745e-02]
 [ 1.84892362e-01  1.21242313e-02  1.99851577e-02 -8.61955745e-02
   1.18197708e+00  9.41691578e-02  1.52463110e-01  6.50814362e-02
   1.85134572e-01  8.18032697e-01]
 [ 3.93229836e-03 -6.43007283e-03 -1.69306859e-02 -3.79245924e-03
   9.41691578e-02  8.64641162e-01  3.43360664e-01 -2.31653204e-01
   4.49226491e-03  9.41691578e-02]
 [ 5.12023262e-02 -1.94010854e-02 -4.52216206e-02 -2.28998452e-01
   1.52463110e-01  3.43360664e-01  8.10464110e-01  1.08012471e-01
   5.16520108e-02  1.52463110e-01]
 [-2.61721115e-02  1.01818019e-02 -8.91957017e-03 -2.94481045e-01
   6.50814362e-02 -2.31653204e-01  1.08012471e-01  8.18934492e-01
  -2.63476037e-02  6.50814362e-02]
 [ 8.17340026e-01 -1.63729687e-03 -3.35532272e-04  5.20774477e-03
   1.85134572e-01  4.49226491e-03  5.16520108e-02 -2.63476037e-02
   1.18130499e+00  1.85134572e-01]
 [ 1.84892362e-01  1.21242313e-02  1.99851577e-02 -8.61955745e-02
   8.18032697e-01  9.41691578e-02  1.52463110e-01  6.50814362e-02
   1.85134572e-01  1.18197708e+00]]


import matplotlib.pyplot as plt
with plt.style.context('dark_background'):
    plt.figure(figsize=(6, 4))
    plt.bar(range(5), exp_var_ratio, alpha=0.5, label='individual explained ratio')
    plt.ylabel('Explained variance ratio')
    plt.xlabel('Principal components')
    plt.legend(loc='best')
    plt.tight_layout()
    plt.show()
"""直接使用原始数据集"""
from sklearn.model_selection import train_teset_split as tts
X_train, X_test, Y_train, Y_test = tts(X, Y, test_size=0.2, random_state=2)
print(X_train.shape)
print(Y_train.shape)
# 结果如下
(49747, 10)
(49747,)

from sklearn.ensemble import RandomForestRegressor as rfr
model = rfr()
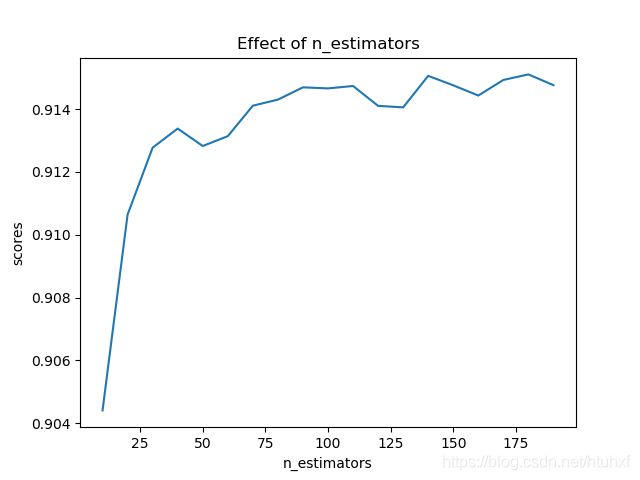
estimators = np.arrange(10, 200, 10)          # the number of the trees in the forest,从版本0.20开始,默认值从10改为了版本0.22的100。
scores = []
for n in estimators:
    model.set_params(n_estimators=n)
    model.fit(X_train, Y_train)                          # 利用训练数据集,训练出模型
    scores.append(model.scores(X_test, Y_test))          # 利用测试数据集,对得到的模型打分
print(scores)
# 结果如下
 [0.9040014330735067, 0.9109092090356825, 0.9122517824346478, 0.9129277530130355,
 0.9128590712148005, 0.9132001350190141, 0.913857581622087, 0.9147146242697467,
 0.914636255828675,  0.914535366763662, 0.9143448626642106, 0.9148543271944425,
 0.9142903118547322,  0.9143236927648354, 0.9144742643877533, 0.915201382906023,
 0.9143135159363284,  0.9149148188838739, 0.9147401488127863]          # 19个i,对应19个score

plt.title('Effect of n_estimators')
plt.xlabel('n_estimators')
plt.ylabel('scores')
plt.plot(estimators, scores)
plt.show()
"""使用标准化X数据"""
X_Train, X_Test, Y_Train, Y_Test = tts(X_pca,Y, test_size=0.2, random_state=2)
print(X_Train.shape)
print(Y_Train.shape)
# 结果如下
(49747, 5)
(49747,)

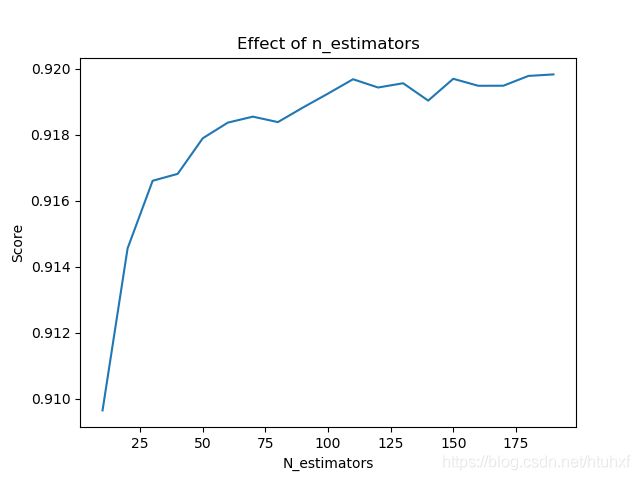
Estimators = np.arange(10, 200, 10)
Scores = []
for i in Estimators:
    model.set_params(n_estimators=i)
    model.fit(X_Train, Y_Train)
    Scores.append(model.score(X_Test, Y_Test))
print(Scores)
# 结果如下
[0.9096519467103993, 0.914557126058388, 0.916603418504708, 0.9168129973427912,
0.9178894023585787, 0.9183634381988838, 0.9185445780186753, 0.9183795517595995,
0.9188206159613067, 0.919242335569966, 0.9196770032171396, 0.919426817311817,
0.9195559294055361, 0.9190303971618293, 0.9196906819559586, 0.9194789130574001,
0.9194809091294857, 0.9197770618950692, 0.9198235192649379]

plt.title('Effect of n_estimators')
plt.xlabel('N_estimators')
plt.ylabel('Score')
plt.plot(Estimators, Scores)
plt.show()
《Hands-On Machine Learning with Scikit-Learn and TenserFlow》的 PCA评价:
“Reducing dimensionality does lose some information (just like compressing an image to JPEG can degrade its quality), so even thought it will speed up training, it may also make your system perform slightly worse. It also makes your piplines a bit more complex and thus harder to maintain. So you should first try to train your system with the original data before considering using dimensionality reduction if training is too slow. In some cases, however, reducing the dimensionality of the training data may filter out some noise and unnecessary details and thus result in higher performance (but in general it won’t; it will just speed up training).”
- PCA本质上是原始变量通过线性变换,组合成新的综合变量,即PC,标明了新变量贡献了多大比例的方差,至于新变量的实际意义,要结合背景赋予意义。


