PCA(主成分分析)降维可视化Matlab实现
实现一个动态展示二维到一维的实例,以及通过使用PCA对其进行简单降维。
1. 二维数据降维动态演示
下图通过使用投影关系将二维点集映射到一维直线上,直观上展示了二维到一维的降维和数据的映射关系。
下图使用含有噪声圆的降维,可用于讲解kernel PCA做铺垫,引出使用Kernel PCA来解决非线性问题。
下面是Matlab代码:
% Writen by: Weichen GU
% Date     : 2020/2/16
clc;clf;clear;
% Generate data
% Data set 1 --- y = x + wgn
data = linspace(-3,3,50);
data = [data;data] + wgn(2,50,1)/5;

% Data set 2 -- x^2 + y^2 = 3 ; x = x + rand, y= y + rand
% idx = 200;                                        % The first and second data sets
% a = linspace(0,8*pi,idx/2);                       % Set the values for x
% u = [3*cos(a) 3*cos(a)]+2.*(rand(1,idx)-0.5);
% v = [3*sin(a) 3*sin(a)]+2.*(rand(1,idx)-0.5);
% data = [u;v];                             % Combine these three data sets together

bound = 5;                      % Display boudary x[-5 5] y[-5 5]
theta = linspace(0,pi,60);%0:0.02:pi;              % The theta of vector / line
[~,n] = size(theta);            % Get the size of theta
vec = [cos(theta); sin(theta)]; % Generate vector for theta
XRange = [-bound;bound];        % X range
YRangeSet = [XRange(1).*tan(theta); XRange(2).*tan(theta)]; % Y range set
dist = vec'*data;               % Dot product of vector and data to obtain the length on vector's direction

% Draw
figure(1);
axis([XRange',XRange']);
hold on;

%pic_num = 1;
for i = 1:n
    cla;                            % Clear figure
    YRange = YRangeSet(:,i);        % Obtain the current YRange
    the = theta(i);                 % Obtain the current theta
    coordinate = [dist(i,:).*cos(the); dist(i,:).*sin(the)];    % Obtain the coordinate of the projection point
    plot(data(1,:),data(2,:),'b.','MarkerSize',10);             % Plot original data
    drawLine(XRange, YRange, the);                              % Draw feature plane
    plot(coordinate(1,:),coordinate(2,:),'r.','MarkerSize',10); % Draw projection points
    X = [data(1,:);coordinate(1,:)];
    Y =[data(2,:); coordinate(2,:)];
    line(X,Y,'color','r');                                      % connect the original data to projection points
    gca = legend('original data','feature plane', 'projection data'); % Add legend
    % Add labels and titles
    xlabel('x');    ylabel('y');    title('Dimension Reduction (from 2-dim to 1-dim)');
    drawnow();                      % Display

    % Just for gif generation
    % F=getframe(gcf);
    % I=frame2im(F);
    % [I,map]=rgb2ind(I,256);
    % if pic_num == 1
    %     imwrite(I,map,'test.gif','gif','Loopcount',inf,'DelayTime',0.2);
    % else
    %     imwrite(I,map,'test.gif','gif','WriteMode','append','DelayTime',0.2);
    % end
    %pic_num = pic_num + 1;

end
hold off


function drawLine(XRange,YRange,theta)
    if(YRange(1)<XRange(1) || YRange(1) > XRange(2))
        if(YRange(1) <0)
            YRange = XRange;
            XRange = YRange./tan(theta);
        else
            YRange = fliplr(XRange);
            XRange = YRange./tan(theta);
        end
    end
    line([XRange(1),XRange(2)],[YRange(1), YRange(2)],'color','k');
end
2. 使用PCA对数据进行降维并显示
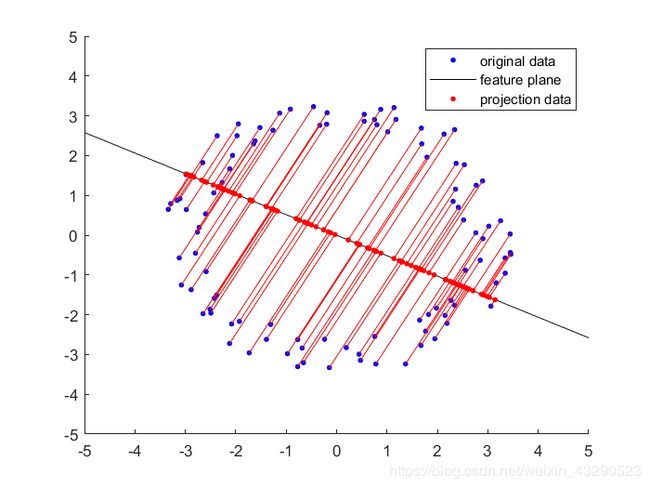
PCA通过求出数据的特征向量和特征值,将数据投影到前k个最大特征值的特征向量上,从而达到降维的目的,下面是PCA降维的结果以及包含PCA的Matlab程序。

% Writen by: Weichen GU
% Date     : 2020/2/16
clc;clf;clear;
% Generate data
% Data set 1 --- y = x + wgn
data = linspace(-3,3,50);
data = [data;data] + wgn(2,50,1)/5;

% Data set 2 -- x^2 + y^2 = 3 ; x = x + rand, y= y + rand
% idx = 100;                                        % The first and second data sets
% a = linspace(0,8*pi,idx/2);                       % Set the values for x
% u = [3*cos(a) 3*cos(a)]+1.*(rand(1,idx)-0.5);
% v = [3*sin(a) 3*sin(a)]+1.*(rand(1,idx)-0.5);
% data = [u;v];                             % Combine these three data sets together

dataT = data';
pcaDim = 1;
[row col] = size(dataT);
covMatrix = cov(dataT); % Obtain the covariance matrix of dataT
[eigVector, eigValue] = eigs(covMatrix);% Obtain the eigen values and eigen vectors
dataMean = mean(dataT);
mean = repmat(dataMean,row,1);
% dataT = dataT-mean; % Centralization

pcaData = (dataT)*eigVector;
pcaData1 = pcaData(:,1:pcaDim);

bound = 5;                      % Display boudary x[-5 5] y[-5 5]
theta = linspace(0,pi,60);%0:0.02:pi;              % The theta of vector / line
[~,n] = size(theta);            % Get the size of theta
vec = [cos(theta); sin(theta)]; % Generate vector for theta
XRange = [-bound;bound];        % X range
YRangeSet = [XRange(1).*tan(theta); XRange(2).*tan(theta)]; % Y range set
dist = vec'*data;               % Dot product of vector and data to obtain the length on vector's direction

% Draw
figure(1);
axis([XRange',XRange']);
%axis equal;
hold on;

%pic_num = 1;
for i = 1:n
    cla;                            % Clear figure
    YRange = YRangeSet(:,i);        % Obtain the current YRange
    the = theta(i);                 % Obtain the current theta
    coordinate = [dist(i,:).*cos(the); dist(i,:).*sin(the)];    % Obtain the coordinate of the projection point
    plot(data(1,:),data(2,:),'b.','MarkerSize',10);             % Plot original data
    drawLine(XRange, YRange, the);                              % Draw feature plane
    plot(coordinate(1,:),coordinate(2,:),'r.','MarkerSize',10); % Draw projection points
    X = [data(1,:);coordinate(1,:)];
    Y =[data(2,:); coordinate(2,:)];
    line(X,Y,'color','r');                                      % connect the original data to projection points
    legend('original data','feature plane', 'projection data'); % Add legend
    % Add labels and titles
    xlabel('x');    ylabel('y');    title('Dimension Reduction (from 2-dim to 1-dim)');
    drawnow();                      % Display
    % Just for gif generation
    % F=getframe(gcf);
    % I=frame2im(F);
    % [I,map]=rgb2ind(I,256);
    % if pic_num == 1
    %     imwrite(I,map,'test.gif','gif','Loopcount',inf,'DelayTime',0.2);
    % else
    %     imwrite(I,map,'test.gif','gif','WriteMode','append','DelayTime',0.2);
    % end
    % pic_num = pic_num + 1;

end
hold off

figure(2)
axis([XRange',XRange']);
%axis equal;
hold on;
cla;
the = atan2(eigVector(2,1),eigVector(1,1));
coordPCA = [pcaData1'.*cos(the); pcaData1'.*sin(the)];    % Obtain the coordinate of the projection point
plot(data(1,:),data(2,:),'b.','MarkerSize',10);             % Plot original data
YRange = XRange.*tan(the);
drawLine(XRange, YRange, the);                              % Draw feature plane

plot(coordPCA(1,:),coordPCA(2,:),'r.','MarkerSize',10); % Draw projection points
X = [data(1,:);coordPCA(1,:)];
Y =[data(2,:); coordPCA(2,:)];
line(X,Y,'color','r');                                      % connect the original data to projection points

legend('original data','feature plane', 'projection data'); % Add legend
hold off;

function drawLine(XRange,YRange,theta)
    if(YRange(1)<XRange(1) || YRange(1) > XRange(2))
        if(YRange(1) <0)
            YRange = XRange;
            XRange = YRange./tan(theta);
        else
            YRange = fliplr(XRange);
            XRange = YRange./tan(theta);
        end
    end
    line([XRange(1),XRange(2)],[YRange(1), YRange(2)],'color','k');
end