python编程从入门到实践——16章
对16章西卡特和死亡谷的天气温度进行绘制在同一个表格的时候,出现绘制了两个表格的情况。代码如下:
#绘制sitka的温度图
dates, highs, lows = [], [], []
get_weather_date(‘sitka_weather_2014.csv’, dates, highs, lows)
#根据数据绘制图形
fig = plt.figure(dpi=128, figsize=(10, 6))#定义的第一个屏幕参数
plt.plot(dates, highs, c=‘red’, alpha=0.5)
plt.plot(dates, lows, c=‘red’, alpha=0.5)
plt.fill_between(dates, highs, lows, facecolor=‘red’, alpha=0.1)
#绘制Death Valley的温度图
dates, highs, lows = [], [], []
get_weather_date(‘death_valley_2014.csv’, dates, highs, lows)
#根据数据绘制图形
fig = plt.figure(dpi=128, figsize=(10, 6))#定义的第二个屏幕参数
plt.plot(dates, highs, c=‘blue’, alpha=0.5)
plt.plot(dates, lows, c=‘blue’, alpha=0.5)
plt.fill_between(dates, highs, lows, facecolor=‘blue’, alpha=0.1)
错误的原因是因为代码中定义了两次屏幕参数,导致绘制了两个屏幕。
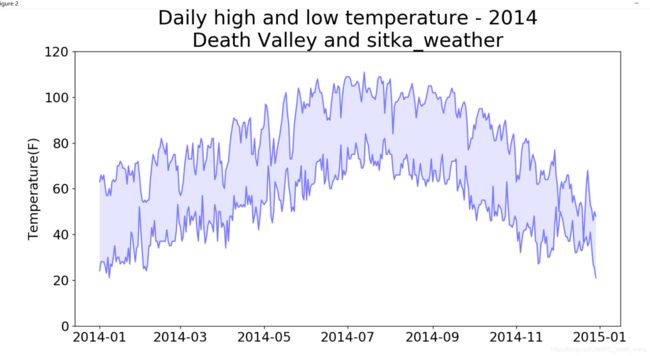
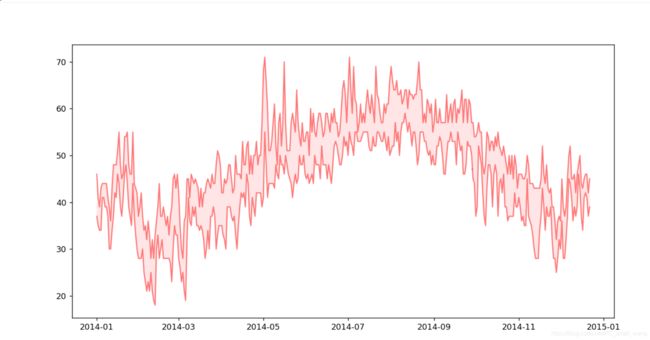
以上的图片是绘制的两个图表,可见第一图表的标题,x轴等有根据代码要求绘制图形格式,而图表2则无。并且图表一的代码是位于图表而的下方,但靠近图表格式要求的代码,所以是否有个就近原则。
#绘制sitka的温度图
dates, highs, lows = [], [], []
get_weather_date(‘sitka_weather_2014.csv’, dates, highs, lows)
#根据数据绘制图形
fig = plt.figure(dpi=128, figsize=(10, 6))
plt.plot(dates, highs, c=‘red’, alpha=0.5)
plt.plot(dates, lows, c=‘red’, alpha=0.5)
plt.fill_between(dates, highs, lows, facecolor=‘red’, alpha=0.1)
#绘制Death Valley的温度图
dates, highs, lows = [], [], []
get_weather_date(‘death_valley_2014.csv’, dates, highs, lows)
#根据数据绘制图形
fig = plt.figure(dpi=128, figsize=(10, 6))
plt.plot(dates, highs, c=‘blue’, alpha=0.5)
plt.plot(dates, lows, c=‘blue’, alpha=0.5)
plt.fill_between(dates, highs, lows, facecolor=‘blue’, alpha=0.1)
#设置图形的格式
plt.title(“Daily high and low temperature - 2014\nDeath Valley and sitka_weather”, fontsize=24)
plt.xlabel(’’, fontsize=16)
plt.ylabel(“Temperature(F)”, fontsize=16)
plt.tick_params(axis=‘both’, which=‘major’, labelsize=16)
plt.ylim(0, 120)
plt.show()

