小白科研笔记:简析3d目标检测框指标计算和结果文本输出以及结果可视化
1. 前言
因为工作需要,要了解3d目标检测框的指标计算过程。
2. 3D目标框数据格式
随便打开一个Ground truth标签,比如000006.txt,可以看到如下的内容:
Car 0.00 2 -1.55 548.00 171.33 572.40 194.42 1.48 1.56 3.62 -2.72 0.82 48.22 -1.62
Car 0.00 0 -1.21 505.25 168.37 575.44 209.18 1.67 1.64 4.32 -2.61 1.13 31.73 -1.30
Car 0.00 0 0.15 49.70 185.65 227.42 246.96 1.50 1.62 3.88 -12.54 1.64 19.72 -0.42
Car 0.00 1 2.05 328.67 170.65 397.24 204.16 1.68 1.67 4.29 -12.66 1.13 38.44 1.73
DontCare -1 -1 -10 603.36 169.62 631.06 186.56 -1 -1 -1 -1000 -1000 -1000 -10
DontCare -1 -1 -10 578.97 168.88 603.78 187.56 -1 -1 -1 -1000 -1000 -1000 -10
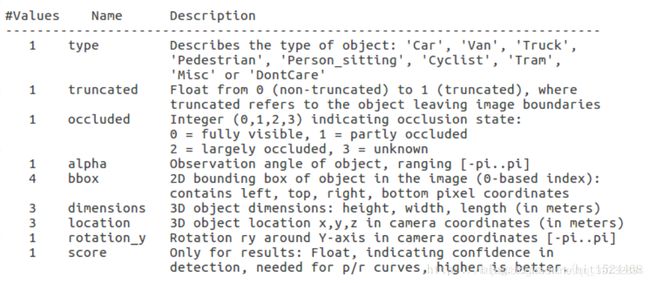
这些数据代表了什么含义呢?可以参考这篇博客。官方给出的数据说明如下所示:
我们以第一个物体来作说明。
Car 0.00 2 -1.55 548.00 171.33 572.40 194.42 1.48 1.56 3.62 -2.72 0.82 48.22 -1.62
它的type标签是Car,说明该物体是车类,如果是Dont Care,表示该物体不纳入目标检测情况之内。它的truncated标签是0,说明这个目标在RGB图像边界内,如果等于1,说明该目标卡在边界上了。它的occluded标签是2,说明这个目标有很大一部分被遮挡住了。它的alpha标签是-1.55,换算为角度约是 − 88 deg -88\, \deg −88deg,表示观测该物体的角度。它的bbox标签是548.00 171.33 572.40 194.42,分别表示该物体在RGB图像上,相应2D框的左上角和右下角顶点的像素坐标。它的dimensions标签是1.48 1.56 3.62,表示目标的高度,宽度,和长度,单位是米。它的location标签是-2.72 0.82 48.22,表示目标中心的位置,单位是米。它的rotation_y标签是-1.62,换算为角度约是 − 92 deg -92\, \deg −92deg,表示物体自身旋转角,这里表示这个物体大概是横着出现在观察者的视线内。从图1上可以看出,score只用于网络预测,真值是1,网络预测值是在 [ 0 , 1 ] [0,1] [0,1]范围之内,表示目标检测置信度。
3. 3D目标框指标计算
3.1 总体计算框架
在我之前的博客已经讲解了3D目标框的四种指标(2D检测框的准确率,3D检测框的准确率,BEV视图下检测框的准确率,以及检测目标旋转角度的准确率)和它们的计算方法,以及不同类别在不同检测指标下的阈值。这里不再叙述。咱们直接看3D框指标计算的代码。这里以SA-SSD的test.py作为说明。
总体代码如下所示:
    # 加载网络参数和测试数据集
    cfg = mmcv.Config.fromfile(args.config)
    cfg.model.pretrained = None

    dataset = utils.get_dataset(cfg.data.val)
    class_names = cfg.data.val.class_names
    if args.gpus == 1:
        model = build_detector(
            cfg.model, train_cfg=None, test_cfg=cfg.test_cfg)
        load_checkpoint(model, args.checkpoint)
        model = MMDataParallel(model, device_ids=[0])

        data_loader = build_dataloader(
            dataset,
            1,
            cfg.data.workers_per_gpu,
            num_gpus=1,
            #collate_fn= cfg.data.collate_fn,
            shuffle=False,
            dist=False)
        # 把测试集的结果一股脑地输出
        outputs = single_test(model, data_loader, args.out, class_names)
    else:
        NotImplementedError
    # kitti evaluation
    # 从 Ground Truth 中提取测试集目标检测的真值
    gt_annos = kitti.get_label_annos(dataset.label_prefix, dataset.sample_ids)
    # 根据目标检测的真值和预测值,计算四个检测指标
    result = get_official_eval_result(gt_annos, outputs, current_classes=class_names)
上述代码的核心函数有三个,分别是:single_test,get_label_annos,和get_official_eval_result。先分析get_label_annos和get_official_eval_result,然后再去分析single_test。
3.2 简析get_label_annos
函数get_label_annos的作用是获取目标检测的真值。
# label_folder 是目标检测真值标签的存放文件夹
# image_ids 是目标检测的 id,list 数组
def get_label_annos(label_folder, image_ids=None):
	# 如果没有 image_ids,就抓取文件夹内所有标签对应 id,再变成 list 格式
    if image_ids is None:
        filepaths = pathlib.Path(label_folder).glob('*.txt')
        prog = re.compile(r'^\d{6}.txt$')
        filepaths = filter(lambda f: prog.match(f.name), filepaths)
        image_ids = [int(p.stem) for p in filepaths]
        image_ids = sorted(image_ids)
    if not isinstance(image_ids, list):
        image_ids = list(range(image_ids))
    # annos 存放所有 id 的真值,是一个 list 结构,存放的是 dict
    annos = []
    label_folder = pathlib.Path(label_folder)
    # 遍历每一个 id, 抓取真值
    for idx in image_ids:
        image_idx_str = get_image_index_str(idx)
        label_filename = label_folder / (image_idx_str + '.txt')
        anno = get_label_anno(label_filename)
        num_example = anno["name"].shape[0] # 这一帧图像中目标的个数
        anno["image_idx"] = np.array([idx] * num_example, dtype=np.int64)
        annos.append(anno)
    return annos
再去看看函数get_label_anno(从文本中抓取目标的真值信息):
def get_label_anno(label_path):
    annotations = {}
    annotations.update({
        'name': [],
        'truncated': [],
        'occluded': [],
        'alpha': [],
        'bbox': [],
        'dimensions': [],
        'location': [],
        'rotation_y': []
    })
    with open(label_path, 'r') as f:
        lines = f.readlines()
    # if len(lines) == 0 or len(lines[0]) < 15:
    #     content = []
    # else:
    content = [line.strip().split(' ') for line in lines]
    num_objects = len([x[0] for x in content if x[0] != 'DontCare'])
    annotations['name'] = np.array([x[0] for x in content])
    num_gt = len(annotations['name'])
    annotations['truncated'] = np.array([float(x[1]) for x in content])
    annotations['occluded'] = np.array([int(float(x[2])) for x in content])
    annotations['alpha'] = np.array([float(x[3]) for x in content])
    annotations['bbox'] = np.array(
        [[float(info) for info in x[4:8]] for x in content]).reshape(-1, 4)
    # dimensions will convert hwl format to standard lhw(camera) format.
    annotations['dimensions'] = np.array(
        [[float(info) for info in x[8:11]] for x in content]).reshape(
            -1, 3)[:, [2, 0, 1]]
    annotations['location'] = np.array(
        [[float(info) for info in x[11:14]] for x in content]).reshape(-1, 3)
    annotations['rotation_y'] = np.array(
        [float(x[14]) for x in content]).reshape(-1)
    if len(content) != 0 and len(content[0]) == 16:  # have score
        annotations['score'] = np.array([float(x[15]) for x in content])
    else:
        annotations['score'] = np.zeros((annotations['bbox'].shape[0], ))
    index = list(range(num_objects)) + [-1] * (num_gt - num_objects)
    annotations['index'] = np.array(index, dtype=np.int32)
    annotations['group_ids'] = np.arange(num_gt, dtype=np.int32)
    return annotations
3.3 简析get_official_eval_result
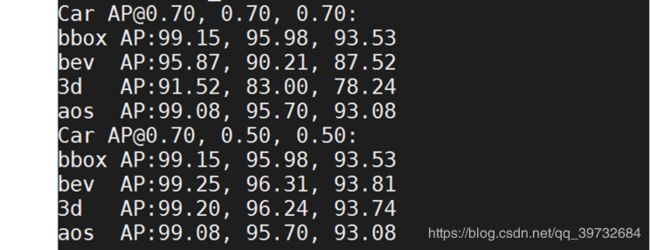
函数get_official_eval_result的作用是根据目标检测的真值和预测值,计算四个检测指标。运行程序时候的输出如下所示:

图2:get_official_eval_result输出示意图
这一块的代码如下所示:
def get_official_eval_result(gt_annos, dt_annos, current_classes, difficultys=[0, 1, 2]):
	# 对八类目标的阈值设定,分为 overlap_0_7 和 overlap_0_5 两大类
	# 咱们主要关注 Car 类
	# 它在 overlap_0_7 检测阈值是 0.7 0.7 0.7
	# 它在 overlap_0_5 检测阈值是 0.7 0.5 0.5
    overlap_0_7 = np.array([[0.7, 0.5, 0.5, 0.7, 0.5, 0.7, 0.7, 0.7],
                            [0.7, 0.5, 0.5, 0.7, 0.5, 0.7, 0.7, 0.7],
                            [0.7, 0.5, 0.5, 0.7, 0.5, 0.7, 0.7, 0.7]])
    overlap_0_5 = np.array([[0.7, 0.5, 0.5, 0.7, 0.5, 0.5, 0.5, 0.5],
                            [0.5, 0.25, 0.25, 0.5, 0.25, 0.5, 0.5, 0.5],
                            [0.5, 0.25, 0.25, 0.5, 0.25, 0.5, 0.5, 0.5]])
    min_overlaps = np.stack([overlap_0_7, overlap_0_5], axis=0)  # [2, 3, 5]
    class_to_name = {
        0: 'Car',
        1: 'Pedestrian',
        2: 'Cyclist',
        3: 'Van',
        4: 'Person_sitting',
        5: 'car',
        6: 'tractor',
        7: 'trailer',
    }
    name_to_class = {v: n for n, v in class_to_name.items()}
    if not isinstance(current_classes, (list, tuple)):
        current_classes = [current_classes]
    current_classes_int = []
    for curcls in current_classes:
        if isinstance(curcls, str):
            current_classes_int.append(name_to_class[curcls])
        else:
            current_classes_int.append(curcls)
    current_classes = current_classes_int
    min_overlaps = min_overlaps[:, :, current_classes]
    result = ''
    # check whether alpha is valid
    compute_aos = False
    for anno in dt_annos:
        if anno['alpha'].shape[0] != 0:
            if anno['alpha'][0] != -10:
                compute_aos = True
            break
    # 检测指标核心计算代码
    mAPbbox, mAPbev, mAP3d, mAPaos = do_eval_v2(
        gt_annos, dt_annos, current_classes, min_overlaps, compute_aos, difficultys)
    # 文本输出的代码
    # j 表示遍历的大类,比如 Car 一类
    for j, curcls in enumerate(current_classes):
        # mAP threshold array: [num_minoverlap, metric, class]
        # mAP result: [num_class, num_diff, num_minoverlap]
        # i 表示遍历 overlap_0_7, overlap_0_5
        # 打印这两种大阈值下的目标检测指标结果,如图 2 所示
        for i in range(min_overlaps.shape[0]):
            result += print_str(
                (f"{class_to_name[curcls]} "
                 "AP@{:.2f}, {:.2f}, {:.2f}:".format(*min_overlaps[i, :, j])))
            # 0, 1, 2 分别对应目标检测的难易程度,
            # 0 --- Easy
            # 1 --- Medium
            # 2 --- Hard
            result += print_str((f"bbox AP:{mAPbbox[j, 0, i]:.2f}, "
                                 f"{mAPbbox[j, 1, i]:.2f}, "
                                 f"{mAPbbox[j, 2, i]:.2f}"))
            result += print_str((f"bev  AP:{mAPbev[j, 0, i]:.2f}, "
                                 f"{mAPbev[j, 1, i]:.2f}, "
                                 f"{mAPbev[j, 2, i]:.2f}"))
            result += print_str((f"3d   AP:{mAP3d[j, 0, i]:.2f}, "
                                 f"{mAP3d[j, 1, i]:.2f}, "
                                 f"{mAP3d[j, 2, i]:.2f}"))
            if compute_aos:
                result += print_str((f"aos  AP:{mAPaos[j, 0, i]:.2f}, "
                                     f"{mAPaos[j, 1, i]:.2f}, "
                                     f"{mAPaos[j, 2, i]:.2f}"))

    return result
3d目标指标计算核心函数是do_eval_v2,简要分析一下这段代码:
def do_eval_v2(gt_annos,
               dt_annos,
               current_classes,
               min_overlaps,
               compute_aos=False,
               difficultys = [0, 1, 2]):
    # min_overlaps: [num_minoverlap, metric, num_class]
    ret = eval_class_v3(gt_annos, dt_annos, current_classes, difficultys, 0,
                        min_overlaps, compute_aos)
    # ret: [num_class, num_diff, num_minoverlap, num_sample_points]
    mAP_bbox = get_mAP_v2(ret["precision"])
    mAP_aos = None
    if compute_aos:
        mAP_aos = get_mAP_v2(ret["orientation"])
    ret = eval_class_v3(gt_annos, dt_annos, current_classes, difficultys, 1,
                        min_overlaps)
    mAP_bev = get_mAP_v2(ret["precision"])
    ret = eval_class_v3(gt_annos, dt_annos, current_classes, difficultys, 2,
                        min_overlaps)
    mAP_3d = get_mAP_v2(ret["precision"])
    return mAP_bbox, mAP_bev, mAP_3d, mAP_aos
函数eval_class_v3构造等着需要的时候再去分析。
3.4 简析single_test和结果文本输出
这一段代码如下所示:
def single_test(model, data_loader, saveto=None, class_names=['Car']):
    template = '{} ' + ' '.join(['{:.4f}' for _ in range(15)]) + '\n'
    if saveto is not None:
        mmcv.mkdir_or_exist(saveto)

	# 网络设置为推断模式
    model.eval()
    # 初始化一个网络预测结果,总存放位置
    annos = []
    prog_bar = mmcv.ProgressBar(len(data_loader.dataset))
    #class_names = get_classes('kitti')

	# 开始把测试集的数据一个一个往里面丢
    for i, data in enumerate(data_loader):
        with torch.no_grad():
        	# results 是网络输出的结果
            results = model(return_loss=False, **data)
        image_shape = (375,1242)
        # 解析网络的输出结果
        for re in results:
            img_idx = re['image_idx']
            if re['bbox'] is not None:
            	# 网络输出的主要结果
                box2d = re['bbox']
                box3d = re['box3d_camera']
                labels = re['label_preds']
                scores = re['scores']
                alphas = re['alphas']
                # 初始化一个 存放网络输出结果的 dict
                anno = kitti.get_start_result_anno()
                num_example = 0
                # 2d框不能超出图像尺寸范围
                for bbox2d, bbox3d, label, score, alpha in zip(box2d, box3d, labels, scores, alphas):
                    if bbox2d[0] > image_shape[1] or bbox2d[1] > image_shape[0]:
                        continue
                    if bbox2d[2] < 0 or bbox2d[3] < 0:
                        continue
                    bbox2d[2:] = np.minimum(bbox2d[2:], image_shape[::-1])
                    bbox2d[:2] = np.maximum(bbox2d[:2], [0, 0])
                    anno["name"].append(class_names[int(label)])
                    anno["truncated"].append(0.0)
                    anno["occluded"].append(0)
                    #anno["alpha"].append(-10)
                    anno["alpha"].append(alpha)
                    anno["bbox"].append(bbox2d)
                    #anno["dimensions"].append(np.array([-1,-1,-1]))
                    anno["dimensions"].append(bbox3d[[3, 4, 5]])
                    #anno["location"].append(np.array([-1000,-1000,-1000]))
                    anno["location"].append(bbox3d[:3])
                    #anno["rotation_y"].append(-10)
                    anno["rotation_y"].append(bbox3d[6])
                    anno["score"].append(score)
                    num_example += 1
                # 把 anno 存放到总体结果 annos 中,顺便写预测结果(如果需要的话)
                if num_example != 0:
                    if saveto is not None:
                        of_path = os.path.join(saveto, '%06d.txt' % img_idx)
                        with open(of_path, 'w+') as f:
                            for name, bbox, dim, loc, ry, score, alpha in zip(anno['name'], \
                                                                       anno["bbox"], \
                                                                       anno["dimensions"], \
                                                                       anno["location"], \
                                                                       anno["rotation_y"], \
                                                                       anno["score"],\
                                                                       anno["alpha"]):
                                # 写检测结果,和 kitti 提供的 ground truth 格式是一样的
                                line = template.format(name, 0, 0, alpha, *bbox, *dim[[1,2,0]], *loc, ry, score)
                                f.write(line)

                    anno = {n: np.stack(v) for n, v in anno.items()}
                    annos.append(anno)
                else:
                    if saveto is not None:
                        of_path = os.path.join(saveto, '%06d.txt' % img_idx)
                        f = open(of_path, 'w+')
                        f.close()
                    annos.append(kitti.empty_result_anno())
            else:
                if saveto is not None:
                    of_path = os.path.join(saveto, '%06d.txt' % img_idx)
                    f = open(of_path, 'w+')
                    f.close()
                annos.append(kitti.empty_result_anno())

            # if show:
            #     model.module.show_result(data, result,
            #                              data_loader.dataset.img_norm_cfg)
            num_example = annos[-1]["name"].shape[0]
            annos[-1]["image_idx"] = np.array(
                [img_idx] * num_example, dtype=np.int64)


        batch_size = len(results)
        for _ in range(batch_size):
            prog_bar.update()

    return annos
4. 可视化3D目标检测结果
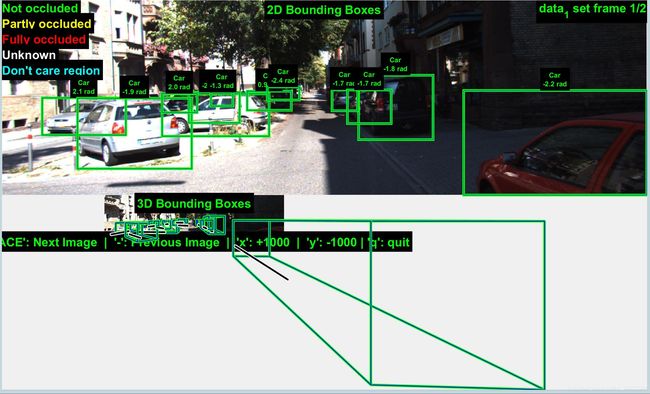
使用kitti官方提供的Matlab可视化代码。Ground Truth可视化效果如下所示:
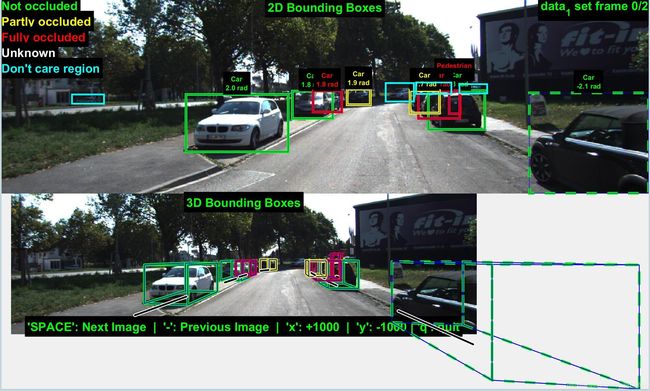
SA-SSD网络预测的效果如下所示(需要把预测的txt文档中的score值去掉才能显示下图,不然只能显示一个目标):

图2:预测标签示意图
还是挺有趣的。

