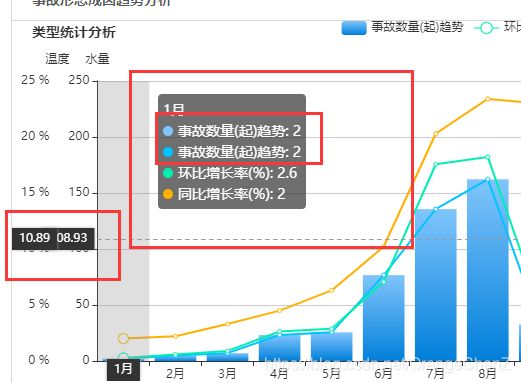
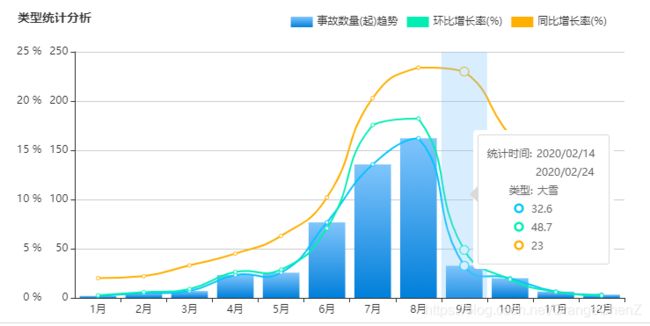
【Echarts】echarts tooltip小箭头,及阴影样式修改,双Y轴显示,折线图和柱状图同时展示,legend分开展示
this.circleChart = {
tooltip: {
trigger: 'item',
backgroundColor: '#fff',
textStyle: {
color: '#666',
fontSize: 14,
lineHeight: 16
},
confine: true,
formatter:
'{a}
{b} : {c} ({d}%)'
},
series: [
{
name: name || '',
type: 'pie',
silent: true,
label: {
normal: {
show: false
}
},
radius: ['0%', '100%'], // 半径
center: ['50%', '50%'], // 位置
color: 'rgba(181,221,245, 0.5)',
data: [{ value: 100, name: '闭环' }]
},
{
name: name || '',
type: 'pie',
radius: ['32%', '63%'], // 半径
center: ['50%', '50%'], // 位置
label: {
normal: {
formatter: '{b}'
}
},
color: SimpleAccidentAnalysisComponent.colors,
data: seriesData || seriesData1,
itemStyle: {
emphasis: {
shadowBlur: 10,
shadowOffsetX: 0,
shadowColor: 'rgba(0, 0, 0, 0.5)'
}
}
}
]
};
this.cllxChart = {
title: {
show: true,
text: '类型统计分析',
textStyle: {
fontSize: 14
},
left: '15',
top: '10'
},
grid: {
left: 20,
right: 30,
bottom: 0,
top: 60,
containLabel: true
},
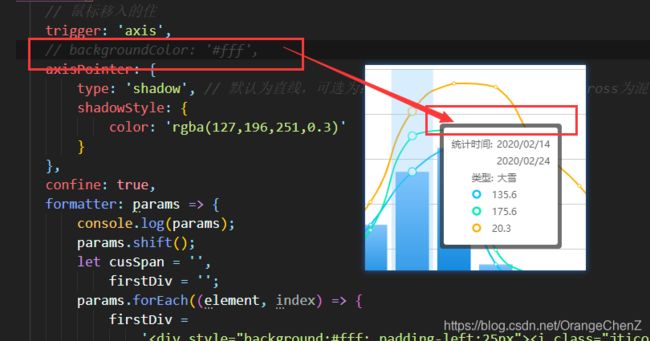
tooltip: {
// 鼠标移入的住
trigger: 'axis',
backgroundColor: '#fff',
axisPointer: {
type: 'shadow', // 默认为直线,可选为:'line' | 'shadow'|'cross' cross为混合显示
shadowStyle: {
color: 'rgba(127,196,251,0.3)'
}
},
confine: true,
formatter: params => {
console.log(params);
params.shift();
let cusSpan = '',
firstDiv = '';
params.forEach((element, index) => {
firstDiv =
'' +
'' +
element.value +
'';
cusSpan += firstDiv;
});
// console.log(cusSpan);
return (
'' +
'统计时间:2020/02/142020/02/24类型:' +
'大雪' +
'' +
cusSpan +
''
);
}
},
// 图例相关的东西
legend: {
x: 'right',
icon: 'rect',
padding: [0, 50, 0, 0],
itemHeight: 12, // 改变icon大小
textStyle: {
fontSize: 12
},
top: '20',
data: [
'事故数量(起)趋势',
'环比增长率(%)',
'同比增长率(%)'
]
},
xAxis: [
{
type: 'category',
data: [
'1月',
'2月',
'3月',
'4月',
'5月',
'6月',
'7月',
'8月',
'9月',
'10月',
'11月',
'12月'
],
axisPointer: {
type: 'shadow'
}
}
],
yAxis: [
{
type: 'value',
// name: '水量', // y轴单位
// min,max会自己计算的,但是间隔会丑,否则就自己循环对比数据得出
min: 0,
max: 250,
interval: 50,
axisLabel: {
formatter: '{value}'
}
},
{
type: 'value',
// name: '温度',
min: 0,
max: 25,
interval: 5,
offset: 30, // 两个y轴得偏移一下,才能不覆盖
position: 'left', // 将y轴的位置移到同一侧
axisLabel: {
formatter: '{value} %'
},
axisLine: {
show: false // 取消y轴
},
axisTick: {
show: false // 取消y轴的刻度线
}
}
],
color: AccidentEportraitAnalysisComponent.lxtjColor,
series: [
{
name: '事故数量(起)趋势',
type: 'bar',
data: [
2.0,
4.9,
7.0,
23.2,
25.6,
76.7,
135.6,
162.2,
32.6,
20.0,
6.4,
3.3
],
itemStyle: {
color: new (echarts as any).graphic.LinearGradient(
0,
0,
0,
1,
[
{ offset: 0, color: '#80C5FC' },
{ offset: 1, color: '#007FDA' }
]
)
}
},
{
name: '事故数量(起)趋势',
type: 'line',
smooth: true,
data: [
2.0,
4.9,
7.0,
23.2,
25.6,
76.7,
135.6,
162.2,
32.6,
20.0,
6.4,
3.3
]
},
{
name: '环比增长率(%)',
type: 'line',
smooth: true,
data: [
2.6,
5.9,
9.0,
26.4,
28.7,
70.7,
175.6,
182.2,
48.7,
18.8,
6.0,
2.3
]
},
{
name: '同比增长率(%)',
type: 'line',
smooth: true,
yAxisIndex: 1,
data: [
2.0,
2.2,
3.3,
4.5,
6.3,
10.2,
20.3,
23.4,
23.0,
16.5,
12.0,
6.2
]
}
]
};
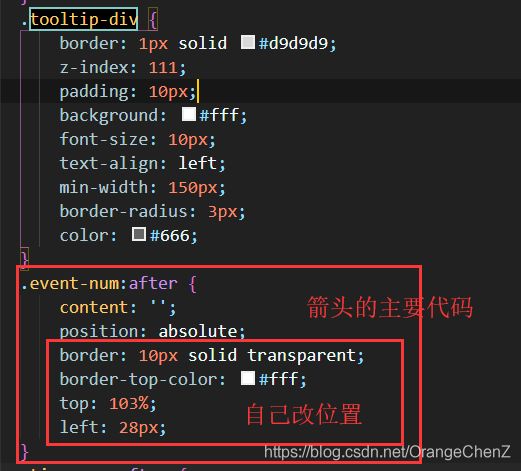
.tooltip-div {
        border: 1px solid #d9d9d9;
        z-index: 111;
        padding: 10px;
        background: #fff;
        font-size: 10px;
        text-align: left;
        min-width: 150px;
        border-radius: 3px;
        color: #666;
    }
    .tooltip-div :after {
        content: '';
        position: absolute;
        border: 10px solid transparent;
        border-top-color: #fff;
        top: 103%;
        left: 28px;
    }


