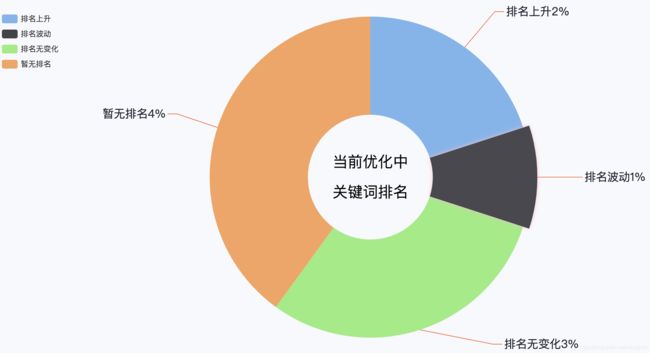
echarts实现环形图
图表效果如下
代码片段
	var data=[];
		data['legendData'] = ['排名上升','排名波动','排名无变化','暂无排名' ];
		data['selected'] = ['排名上升','排名波动','排名无变化','暂无排名'];
		data['seriesData']=[{'name':'排名上升','value':2,'itemStyle': {'color':'#7CB5ED'}},{'name':'排名波动','value':1,'itemStyle': {'color':'#424248'}},{'name':'排名无变化','value':3,'itemStyle': {'color':'#91ED7C'}},{'name':'暂无排名','value':4,'itemStyle': {'color':'#F7A35D'}}]
		var myChart = echarts.init(document.getElementById('main'));

option = {
	animationType:'scale',
    graphic:{
            type:'text',
            left:'center',
            top:'center',
            style:{
                text:'当前优化中\n\n关键词排名',
                textAlign:'center',
                fill:'#000',
                width:30,
                height:30,
                fontSize:24
            }
        },
    title : {
        text: '',
        subtext: '',
        x:'center'
    },
    legend: {
        type: 'scroll',
        orient: 'vertical',
        left: 10,
        top: 20,
        bottom: 20,
        data: data.legendData,
        selected: data.selected
    },
    series : [
        {
            type: 'pie',
            radius : ['35%','90%'],
            center: ['50%', '50%'],
            data: data.seriesData,
            itemStyle: {
                emphasis: {
                    shadowBlur: 10,
                    shadowOffsetX: 0,
                    shadowColor: 'pink'
                },
                 normal: {
                    label: {
                        show: true,
                        position: 'top',
                        formatter: '{b}{c}%',
                        fontSize:18
                    }
                }
            },
            labelLine:{
                normal:{
					length:70,
					lineStyle: {
						color:'#FC5F35'  // 改变标示线的颜色
					}
				},
            },
			label: {
				normal: {
					textStyle: {
							color: '#1F212D'  // 改变标示文字的颜色
					}
				}
			},
        }
    ]
};
 myChart.setOption(option);
myChart.on('mouseover',(v) => {
           console.log($(this));
        });
想要使用echarts制作该图表,只需要复制以上代码,再下载echarts.js在页面文件中引入即可.
echarts.js 下载链接: http://echarts.baidu.com/download.html
这例子的data,我们需要用ajax获取,动态获取