Matplotlib 入门
基本绘图
import matplotlib.pyplot as plt

plt.ylabel("Grade")    #设置Y轴标签
plt.plot([1,5,9,10,12,15], [3,2,7,9,0,1])    #(X轴,Y轴)
plt.savefig('test', dpi=600)    #另存为PNG文件,每英寸像素点为600
plt.axis([-1, 10, 0, 12])    #设置坐标轴范围,x∈[-1, 10]  y[∈0, 6]
plt.show()  #显示图像
设置绘图区域
import matplotlib.pyplot as plt

plt.subplot(a, b, c)    #将绘图区域划分为a行、b列的a*b块,选取第c块进行图像绘制
例:
import matplotlib.pyplot as plt
import numpy as np

def f(t):
    return np.exp(-t) * np.cos(2*np.pi*t)

a = np.arange(0.0, 5.0, 0.02)

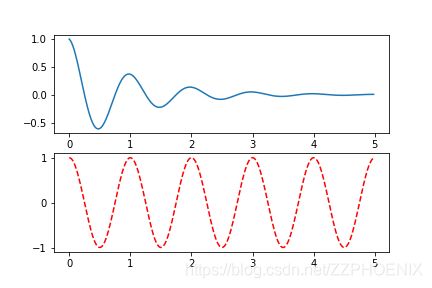
plt.subplot(2,1,1)
plt.plot(a, f(a))

plt.subplot(2,1,2)
plt.plot(a, np.cos(2*np.pi*a), 'r--')
plt.show()
结果:
绘图函数plot()
plt.plot(x, y, format_string, **kwargs)
- x: X轴数据,列表或数组,可选
- y: Y轴数据,列表或数组
- format_string: 控制曲线的格式字符串,可选,由颜色字符、风格字符和标记字符组成
- **kwargs: 第二组或更多(x, y, format_string),用以同时绘制多条曲线
中文显示
方法一:
通过修改全局字体达到目的,不推荐
import matplotlib
matplotlib.rcParams['font.family'] = 'SimHei'
方法二:
在有中文输入的地方增加属性: fontproperties
import maplotlib

plt.xlabel('横轴:时间', fontproperties='SimHei') #只对X轴有效
文本显示
- plt.xlabel() 对X轴增加文本标签
- plt.ylabel() 对Y轴增加文本标签
- plt.title() 对图形整体增加文本标签
- plt.text() 在任意位置增加文本
plt.text(x, y, s, **kwargs)
(x, y)添加文本的坐标位置,s为添加的文本
- plt.annotate() 添加注释
plt.annotate(s, xy=arrow_crd, xytext=text_crd, arrowprops=dict)
s:要注解的字符串
xy:箭头所在位置
xytext:文本所在位置
arrowprops:箭头相关参数
绘制子图
利用plt.subplot2grid()绘制复杂子图
方法一
plt.subplot2grid(GridSpec, CurSpec, colspan=1, rowspan=1)
- GridSpec: 将主图划分的基本形状,如(3,3)将图分成3x3共九块子图
- CurSpec:当前选中的子图区域,如(1,0)选中第一行第0列
- colspan:从当前选中的子图位置延伸列的宽度,如colspan=2则延伸列的宽度至2
- rowspan:从当前选中的子图位置延伸行的长度,如rowspan=2则延伸行的长度至2
例:
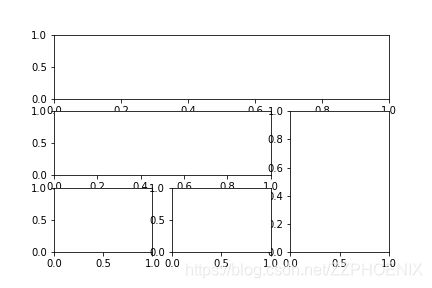
plt.subplot2grid((3,3),(0,0),colspan=3)
plt.subplot2grid((3,3),(1,0),colspan=2)
plt.subplot2grid((3,3),(1,2),rowspan=2)
plt.subplot2grid((3,3),(2,0))
plt.subplot2grid((3,3),(2,1))
结果:
import matplotlib.gridspec as gridspec
gs = gridspec.GridSpec(3,3)

ax1 = plt.subplot(gs[0, :]) #gs[r,c] r为行, c为列
ax2 = plt.subplot(gs[1, :-1])
ax3 = plt.subplot(gs[1:, -1])
ax4 = plt.subplot(gs[2, 0])
ax5 = plt.subplot(gs[2, 1])
结果:


