python绘图---matplotlib几个简单例子
一、前提
import matplotlib.pyplot as plt
from matplotlib.font_manager import FontProperties
font_set = FontProperties(fname=r"c:\windows\fonts\simsun.ttc", size=15)#导入宋体字体文件
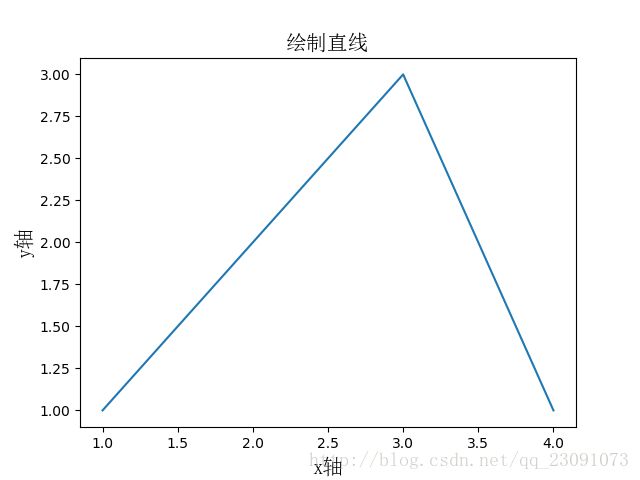
二、绘制直线或折线
dataX = [1,2,3,4]
dataY = [1,2,3,1]
plt.plot(dataX,dataY)#plot还有很多参数,可以查API修改,如颜色,虚线等
plt.title("绘制直线",FontProperties=font_set);
plt.xlabel("x轴",FontProperties=font_set);
plt.ylabel("y轴",FontProperties=font_set);
plt.show()
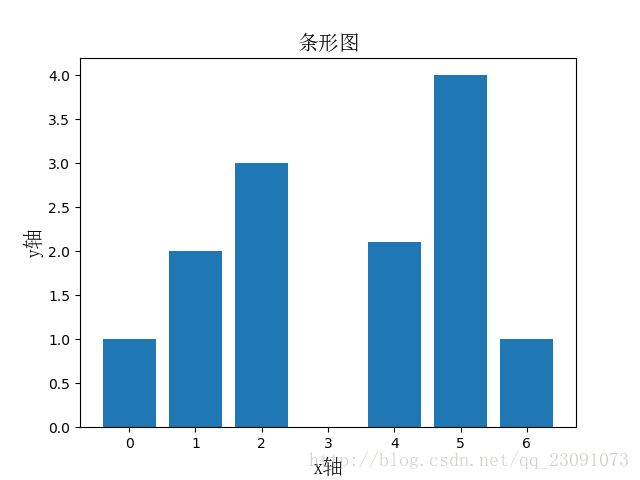
三、绘制条形图
# 条形图
x = [0,1,2,4,5,6]
y = [1,2,3,2.1,4,1]
plt.bar(x,y)#竖的条形图
#plt.barh(x,y)#横的条形图,注意x,y坐标
plt.title("条形图",FontProperties=font_set);
plt.xlabel("x轴",FontProperties=font_set);
plt.ylabel("y轴",FontProperties=font_set);
plt.show()
四、散点图
# 散点图
x = [1,2,3,4,5,6,7,8,9]
y = [0,2,3,4,2,3,4,5,4]
plt.scatter(x,y)
# plt.scatter(x, y,c="g", alpha=0.5, marker=r'$\clubsuit$',label="Luck")
plt.show()
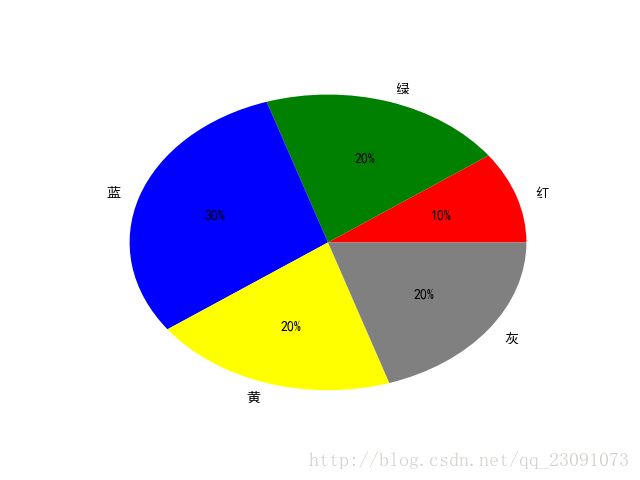
五、饼图
# 饼图
from pylab import *
mpl.rcParams['font.sans-serif'] = ['SimHei']
#解决中文不显示,pie没有FontProperties属性,不能使用上面的方法

labels = ("红","绿","蓝","黄","灰")
colors = ("red","green","blue","yellow","gray")
fracs = [10,20,30,20,20]

plt.pie(fracs,labels=labels,colors=colors,autopct='%1.0f%%')
plt.show()
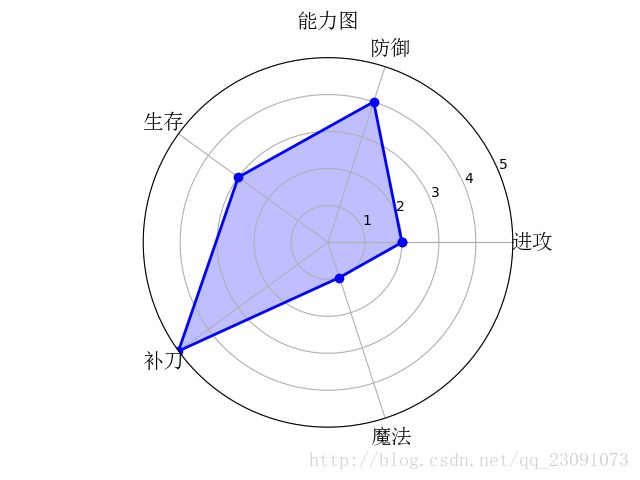
六、雷达图
import numpy as np
#标签
labels = np.array(['进攻','防御','生存','补刀','魔法'])
#数据个数
dataLenth = 5
#数据
data = np.array([2,4,3,5,1])

angles = np.linspace(0, 2*np.pi, dataLenth, endpoint=False)
# linspace创建等差数列 0到2pi之间dataLength个数据
# 第二个数据是否是最后的数据,默认为True
data = np.concatenate((data, [data[0]])) # 闭合
# 加入第一个数据,闭合

angles = np.concatenate((angles, [angles[0]])) # 闭合
# 角度也闭合

fig = plt.figure()
ax = fig.add_subplot(111, polar=True)# polar参数!!
# 111表示1行1列处于第1个,polar设为极坐标

ax.plot(angles, data, 'bo-', linewidth=2)# 画线
ax.fill(angles, data, facecolor='b', alpha=0.25)# 填充
ax.set_thetagrids(angles * 180/np.pi, labels, fontproperties=font_set)
ax.set_title("能力图", va='bottom', fontproperties=font_set)
ax.set_rlim(0,5)
ax.grid(True)
plt.show()
更多例子可以访问matplotlib官网


