Python可视化初级(三)——常见图形绘制
3.1 柱状图
柱状图主要应用在定性数据的可视化场景里面,或者是分类特征的分布展示,那么由柱状图衍生出来的图形还有堆积柱状图,多数据并列柱状图
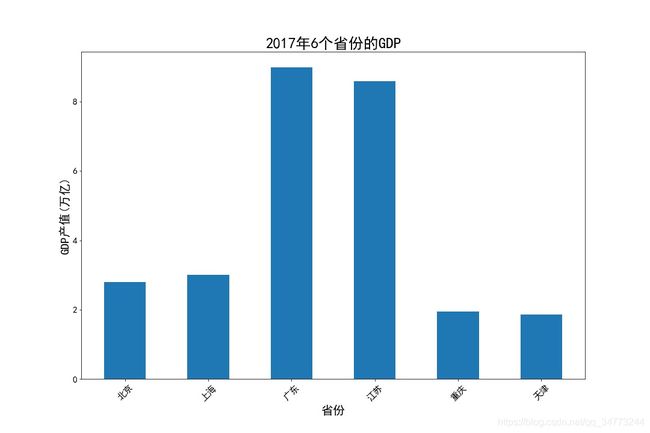
eg1:简单柱状图
之前的绘图都是直接使用plt.xxx来对图形进行操作,这里使用fig代表绘图窗口(Figure),ax代表这个绘图窗口上的坐标系(axes)。后面的ax.xxx则是表示对ax坐标系进行xxx操作。
fig,ax = plt.subplot()等价于
fig = plt.figure()
ax = plt.add_subplot(111)
# fig, ax = plt.subplots(figsize=(15,10)) 创建一个绘图对象
GDP = pd.read_excel('Province GDP 2017.xlsx')
fig, ax = plt.subplots(figsize=(15,10)) #创建一个绘图对象
ax.bar(GDP.index.values,GDP.GDP,0.5) #0.5代表柱状的宽度
ax.set_xticks(GDP.index.values) #位置
ax.set_xticklabels(GDP.Province,rotation = 45) #给每个位置一个具体的标签
plt.xticks(fontsize=15 )
plt.yticks(fontsize=15)
ax.set_xlabel('省份',fontsize = 20)
ax.set_ylabel('GDP产值(万亿)',fontsize = 20)
ax.set_title('2017年6个省份的GDP',fontsize = 25)
plt.show()eg2:堆叠图
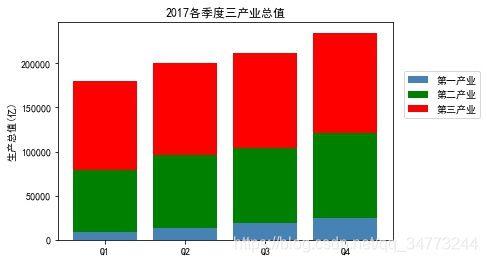
industry_GDP = pd.read_excel('Industry_GDP.xlsx')
temp = pd.crosstab(industry_GDP['Quarter'],
                   industry_GDP['Industry_Type'],
                   values=industry_GDP['GDP'],
                   aggfunc=np.sum)#生成透视图
plt.bar(x= temp.index.values,
        height= temp['第一产业'],
        color='steelblue',
        label='第一产业',
        tick_label = temp.index.values)
plt.bar(x= temp.index.values,
        height= temp['第二产业'],bottom =temp['第一产业'],
        color='green',label='第二产业',
        tick_label = temp.index.values)
plt.bar(x= temp.index.values,
        height = temp['第三产业'],bottom =temp['第一产业'] +  temp['第二产业'],
        color='red',label='第三产业',
        tick_label = temp.index.values)
plt.ylabel('生产总值(亿)')
plt.title('2017各季度三产业总值')
plt.legend(loc=2, bbox_to_anchor=(1.02,0.8)) #图例显示在外面
plt.show()- 堆叠图要注意通过height和bottom来控制堆叠的位置
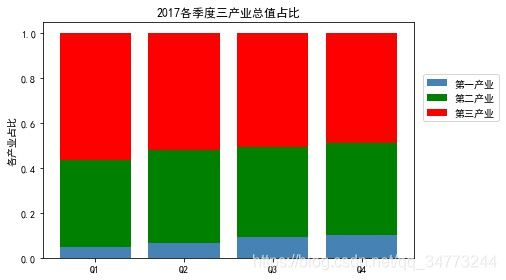
eg3:堆叠图占比
temp = pd.crosstab(industry_GDP['Quarter'],industry_GDP['Industry_Type'],values=industry_GDP['GDP'],aggfunc=np.sum)
temp = temp.div(temp.sum(1).astype(float), axis=0)
plt.bar(x= temp.index.values,
        height= temp['第一产业'],
        color='steelblue',
        label='第一产业',
        tick_label = temp.index.values)
plt.bar(x= temp.index.values,
        height= temp['第二产业'],
        bottom =temp['第一产业'], c
        olor='green',
        label='第二产业',
        tick_label = temp.index.values)
plt.bar(x= temp.index.values,
        height = temp['第三产业'],
        bottom =temp['第一产业'] +  temp['第二产业'],
        color='red',
        label='第三产业',
        tick_label = temp.index.values)
plt.ylabel('各产业占比')
plt.title('2017各季度三产业总值占比')
plt.legend(loc = 2,bbox_to_anchor=(1.01,0.8))
plt.show()- 堆叠图占比要注意temp = temp.div(temp.sum(1).astype(float), axis=0)计算百分比
eg4:垂直交错柱状图
temp = pd.crosstab(industry_GDP['Quarter'],industry_GDP['Industry_Type'],values=industry_GDP['GDP'],aggfunc=np.sum)
bar_width = 0.2 #设置宽度
quarter = temp.index.values #取出季度名称
plt.bar(x= np.arange(0,4),
        height= temp['第一产业'],
        color='steelblue',
        label='第一产业',
        width = bar_width)
plt.bar(x= np.arange(0,4) + bar_width,
        height= temp['第二产业'],
        color='green',
        label='第二产业',
        width=bar_width)
plt.bar(x= np.arange(0,4) + 2*bar_width,
        height= temp['第三产业'],
        color='red',
        label='第三产业',
        width=bar_width)
plt.xticks(np.arange(4)+0.2,quarter,fontsize=12)
plt.ylabel('生产总值(亿)',fontsize=15)
plt.title('2017各季度三产业总值',fontsize=20)
plt.legend(loc = 'upper left')
plt.show()
- 垂直交错的柱状图要注意每次画的柱状图的位置要平移其宽度
3.2 条形图
条形图和柱状图一样,最大区别就是以柱体由垂直变成水平方向了
这里就举两几个例子,不再做过多赘述
- 条形图与柱状图的区别在于plt.bar与plt.barh的区别其中参数x,height,width,bottom等对应于y,width,height,left等。
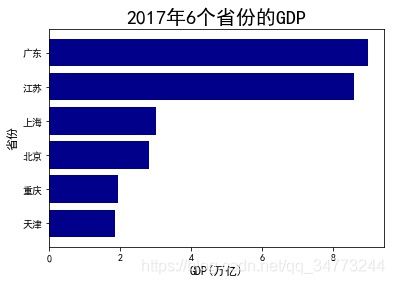
eg1:简单条形图
GDP = GDP.sort_values(by ='GDP')
plt.barh(y=range(GDP.shape[0]) ,
         width=GDP.GDP.values,
         color='darkblue',
         align='center',
         tick_label= GDP.Province.values)
plt.xlabel('GDP(万亿)',fontsize=12)
plt.ylabel('省份',fontsize=12)
plt.title('2017年6个省份的GDP',fontsize=20)
plt.show()
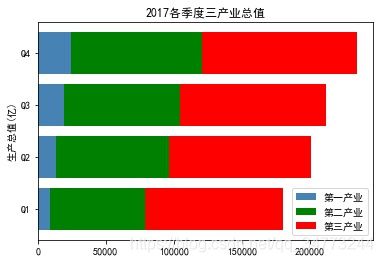
eg2:堆叠条形图
industry_GDP = pd.read_excel('Industry_GDP.xlsx')
temp = pd.crosstab(industry_GDP['Quarter'],industry_GDP['Industry_Type'],values=industry_GDP['GDP'],aggfunc=np.sum)
plt.barh(y= temp.index.values,
         width= temp['第一产业'],
         color='steelblue',
         label='第一产业',
         tick_label = temp.index.values)
plt.barh(y= temp.index.values,
         width= temp['第二产业'],
         left =temp['第一产业'],
         color='green',
         label='第二产业',
         tick_label = temp.index.values)
plt.barh(y= temp.index.values,
         width = temp['第三产业'],
         left =temp['第一产业'] +  temp['第二产业'],
         color='red',
         label='第三产业',
         tick_label = temp.index.values)
plt.ylabel('生产总值(亿)')
plt.title('2017各季度三产业总值')
plt.legend(loc = 'lower right')
plt.show()
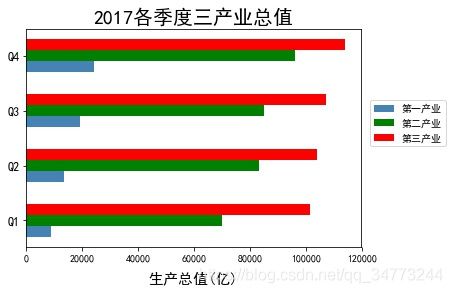
eg3:水平交错条形图
temp = pd.crosstab(industry_GDP['Quarter'],industry_GDP['Industry_Type'],values=industry_GDP['GDP'],aggfunc=np.sum)
bar_width = 0.2 #设置宽度
fig1 = plt.figure('fig1')
quarter = temp.index.values #取出季度名称
plt.barh(y= np.arange(0,4) ,
         width= temp['第一产业'],
         color='steelblue',
         label='第一产业',
         height =bar_width)
plt.barh(y= np.arange(0,4) + bar_width,
         width= temp['第二产业'],
         color='green',
         label='第二产业',
         height = bar_width )
plt.barh(y= np.arange(0,4) + 2*bar_width,
         width= temp['第三产业'],
         color='red',
         label='第三产业',
         height = bar_width )
plt.yticks(np.arange(4)+0.2,quarter,fontsize=12)
plt.xlabel('生产总值(亿)',fontsize=15,labelpad =10)
plt.title('2017各季度三产业总值',fontsize=20)
# plt.legend(loc = 'lower right')
plt.legend(loc=2, bbox_to_anchor=(1.01,0.7)) #图例显示在外面
# plt.show()
fig1.show()
3.3 直方图
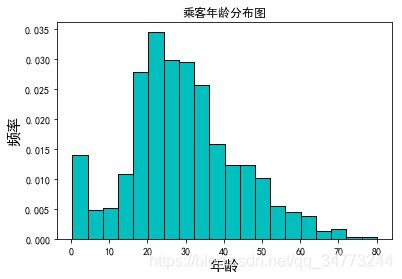
直方图,一般用来观察数据的分布形态,横坐标代表数值的分段,纵坐标代表了观测数量和频数, 一般直方图都会和核密度图搭配使用,主要是为了更具体的了解数据的分布特征,在实际当中, 很多时候需要通过图形来判断数据的分布是不是和正态分布图接近
eg1:简单直方图
# 读取Titanic数据
Titanic = pd.read_csv('titanic_train.csv')
Titanic.dropna(subset=['Age'], inplace=True)
# 绘制直方图
plt.hist(x = Titanic.Age,
         bins=20,
         color='c',
         edgecolor ='black',
         density=True)
plt.xlabel('年龄',fontsize =15)
plt.ylabel('频率',fontsize =15)
plt.title('乘客年龄分布图')
plt.show()
eg2:添加核密度图和正态分布图
# 定义正态分布概率密度公式
#normfun正态分布函数,mu: 均值,sigma:标准差,pdf:概率密度函数,np.exp():概率密度函数公式
def normfun(x,mu, sigma):
    pdf = np.exp(-((x - mu)**2) / (2* sigma**2)) / (sigma * np.sqrt(2*np.pi))
    return pdf
mean_x = Titanic.Age.mean()
std_x = Titanic.Age.std()
# x的范围为60-150,以1为单位,需x根据范围调试
x = np.arange(min(Titanic.Age), max(Titanic.Age)+10,1)
# x数对应的概率密度
y = normfun(x, mean_x, std_x)
plt.hist(x=Titanic.Age,
         bins=20,color='c',
         edgecolor ='black',
         label ='分布图',d
         ensity=True)
plt.plot(x,y, color='g',linewidth = 3,label ='正态分布图') #正态分布图
Titanic['Age'].plot(kind='kde',color='red',xlim=[0,90],label='核密度图')
plt.xlabel('年龄',fontsize =15,labelpad=15)
plt.ylabel('频率',fontsize =15,labelpad=15)
plt.title('乘客年龄分布图')
plt.legend()
plt.show()
3.4 饼图
饼图主要用于定性数据的可视化分析中,通过绘制饼图,可以直观的反映研究对象定性数据 的比例分布情况
eg1:带图例的饼图
elements = ['面粉','砂糖','奶油','草莓酱','坚果']
weights =[40,15,20,10,15]
colors = ['#1b9e77', '#d95f02','#7570b3','#66a613','#e6ab02']
wedges,texts,autotexts = plt.pie(weights,autopct='%3.1f%%',
                                 labels = elements,
                                 textprops=dict(color='w'),
                                 colors=colors)
plt.legend(wedges,elements,fontsize=12,title='配比表',
           bbox_to_anchor=(0.9,0.9)) # 上下左右的
plt.setp(autotexts,size=15,weight='bold')
plt.setp(texts,size=15, color = 'b')
plt.axis('equal')
plt.title('果酱面包配料比例表',fontsize = 20)
plt.show()- wedges:图例
- texts:标签
- autotexts:百分比数
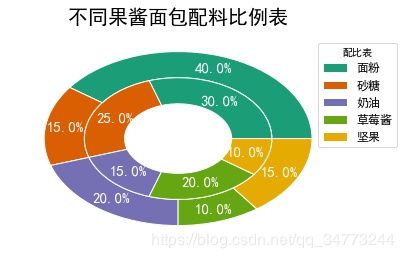
eg2:内嵌环形饼图
elements = ['面粉','砂糖','奶油','草莓酱','坚果']
weights1 =[40,15,20,10,15]
weights2 =[30,25,15,20,10]
outer_colors = ['#1b9e77', '#d95f02','#7570b3','#66a613','#e6ab02']
inner_colors = ['#1b9e77', '#d95f02','#7570b3','#66a613','#e6ab02']
wedges1,texts1,autotexts1 = plt.pie(weights1,autopct='%3.1f%%',
                                    radius =1,pctdistance=0.85,
                                    colors=outer_colors,
                                    textprops=dict(color='w'),
                                    wedgeprops=dict(width=0.3,edgecolor='w'))
wedges2,texts2,autotexts2 = plt.pie(weights2,autopct='%3.1f%%',
                                    radius =0.7, pctdistance=0.75,
                                    colors=inner_colors,
                                    textprops=dict(color='w'),
                                    wedgeprops=dict(width=0.3,edgecolor='w'))
plt.legend(wedges1,elements,fontsize=12,title='配比表',loc ='center left',
           bbox_to_anchor =(0.9, 0.2, 0.3, 1))
plt.setp(autotexts1,size=15,weight='bold')
plt.setp(autotexts2,size=15,weight='bold')
plt.setp(texts1,size=12)
plt.title('不同果酱面包配料比例表',fontsize = 20)
plt.show()- 参数wedgeprops内的width影响内嵌的圆
3.5 箱线图
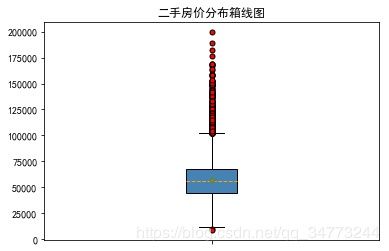
箱线图是由一个箱体和一对箱须组成的统计图形。箱体是由第一四分位数,中位数和第三四分 位数所组成的。在箱须的末端之外的数值可以理解成离群值,箱线图可以对一组数据范围大 致进行直观的描述
plt.boxplot(x,notch,sym,vert,whis,positions,widths,patch_artist,meanline,showmeans, boxprops,labels,flierprops - x: 数据
- width:宽度
- patch_artist: 是否填充箱体颜色
- meanline:是否显示均值
- showmeans: 是否显示均值
- meanprops;设置均值属性,如点的大小,颜色等
- medianprops:设置中位数的属性,如线的类型,大小等
- showfliers: 是否表示有异常值
- boxprops:设置箱体的属性,边框色和填充色
- cappops: 设置箱线顶端和末端线条的属性,如颜色,粗细等
eg1:简单箱线图
sec_building = pd.read_excel('sec_buildings.xlsx')
plt.boxplot(x=sec_building.price_unit,patch_artist=True,showmeans =True,
            boxprops={'color':'black','facecolor':'steelblue'},
            showfliers=True,
            flierprops={'marker':'o','markerfacecolor':'red','markersize':5},
            meanprops={'marker':'D','markerfacecolor':'indianred','markersize':4},
            medianprops={'linestyle':'--','color':'orange'},labels=[''])
plt.title('二手房价分布箱线图')
plt.savefig('1.jpg', bbox_inches = 'tight')
plt.show()
eg2:绘制分组箱线图
# 二手房在各行政区域的平均单价
group_region = sec_building.groupby('region')
avg_price = group_region.aggregate({'price_unit':np.mean}).sort_values('price_unit', ascending = False)
# 通过循环,将不同行政区域的二手房存储到列表中
region_price = []
for region in avg_price.index:
    region_price.append(sec_building.price_unit[sec_building.region == region])
# 绘制分组箱线图
plt.boxplot(x = region_price,
            patch_artist=True,
            labels = avg_price.index, # 添加x轴的刻度标签
            showmeans=True,
            boxprops = {'color':'black', 'facecolor':'steelblue'},
            flierprops = {'marker':'o','markerfacecolor':'red', 'markersize':3},
            meanprops = {'marker':'D','markerfacecolor':'indianred', 'markersize':4},
            medianprops = {'linestyle':'--','color':'orange'}
           )
# 添加y轴标签
plt.ylabel('单价(元)')
# 添加标题
plt.title('不同行政区域的二手房单价对比')
# 显示图形
plt.show()
3.6 散点图
如果要研究两个连续型变量之间的关系,用散点图来展示是最佳的选择,如果要研究不同类 别下两个连续型变量的关系,用散点图也是最佳选择
eg:绘制不同种类的散点图关系
iris = pd.read_csv('iris.csv')
plt.scatter(x = iris.Petal_Width[iris['Species'] =='setosa'],
            y = iris.Petal_Length[iris['Species'] =='setosa'],
            s =20,
            color ='steelblue',
            marker='o',
            label = 'setosa',
            alpha=0.8)
plt.scatter(x = iris.Petal_Width[iris['Species'] =='versicolor'],
            y = iris.Petal_Length[iris['Species'] =='versicolor'],
            s =30,
            color ='indianred',
            marker='s',
            label = 'versicolor')
plt.scatter(x = iris.Petal_Width[iris['Species'] =='virginica'],
            y = iris.Petal_Length[iris['Species'] =='virginica'],
            s =40,
            color ='green',
            marker='x',
            label = 'virginica')
plt.xlabel('花瓣宽度',fontsize=12)
plt.ylabel('花瓣长度',fontsize=12)
plt.title('不同种类的鸢尾花花瓣宽度和长度关系图')
plt.legend(loc='upper left')
plt.show()
也可以使用循环的方式读取数据
colors_iris = ['steelblue','indianred','green']
sepcies =[ 'setosa','versicolor','virginica']
marker_iris =['o','s','x']
for i in range(0,3):
    plt.scatter(x=iris.Petal_Width[iris['Species'] ==sepcies[i]],
                y=iris.Petal_Length[iris['Species'] == sepcies[i]],
                s=20,
                color=colors_iris[i],
                marker=marker_iris[i],
                label=sepcies[i])
plt.xlabel('花瓣宽度',fontsize = 12, labelpad =20)
plt.ylabel('花瓣长度',fontsize = 12, labelpad =20)
plt.title('不同种类的鸢尾花花瓣宽度和长度关系图',fontsize =12)
plt.legend(loc='upper left')
plt.show()
3.7 折线图
折线图是将数据点按照顺序连接起来的图形,可以认为主要作用是查看y随着x改变的 趋势,非常适合时间序列分析
eg1:绘制不同类型的折线图
pd.set_option('display.max_columns', 8)
data = np.load('国民经济核算季度数据.npz')
name = data['columns'] ## 提取其中的columns数组,视为数据的标签
values = data['values']## 提取其中的values数组,数据的存在位置
fig =plt.figure(figsize=(8,7)) # 创建画布
ax = fig.add_axes([0.15,0.2,0.8,0.7]) # Axes是画布上的绘图区域
plt.plot(values[:,0],values[:,3],'bs-',
       values[:,0],values[:,4],'ro-.',
       values[:,0],values[:,5],'gH--')## 绘制折线图
plt.xlabel('年份')## 添加横轴标签
plt.ylabel('生产总值(亿元)')## 添加y轴名称
plt.xticks(range(0,70,4),values[range(0,70,4),1],rotation=45)
plt.title('2000-2017年各产业季度生产总值折线图')## 添加图表标题
plt.legend(['第一产业','第二产业','第三产业'])
# plt.savefig('2000-2017年季度各产业生产总值折线图.pdf')
plt.show()
eg2:绘制子图
p1 = plt.figure(figsize=(8,7))## 设置画布
## 子图1
ax3 = p1.add_subplot(2,1,1)
plt.plot(values[:,0],values[:,3],'b-',
        values[:,0],values[:,4],'r-.',
        values[:,0],values[:,5],'g--')## 绘制折线图
plt.ylabel('生产总值(亿元)')## 添加纵轴标签
plt.title('2000-2017年各产业季度生产总值折线图')## 添加图表标题
plt.legend(['第一产业','第二产业','第三产业'])## 添加图例
## 子图2
ax4 = p1.add_subplot(2,1,2)
plt.plot(values[:,0],values[:,6], 'r-',## 绘制折线图
        values[:,0],values[:,7], 'b-.',## 绘制折线图
        values[:,0],values[:,8],'y--',## 绘制折线图
        values[:,0],values[:,9], 'g:',## 绘制折线图
        values[:,0],values[:,10], 'c-',## 绘制折线图
        values[:,0],values[:,11], 'm-.',## 绘制折线图
        values[:,0],values[:,12], 'k--',## 绘制折线图
        values[:,0],values[:,13], 'r:',## 绘制折线图
        values[:,0],values[:,14], 'b-')## 绘制折线图
plt.legend(['农业','工业','建筑','批发','交通',
        '餐饮','金融','房地产','其他'])
plt.xlabel('年份')## 添加横轴标签
plt.ylabel('生产总值(亿元)')## 添加纵轴标签
plt.xticks(range(0,70,4),values[range(0,70,4),1],rotation=45)
plt.show()