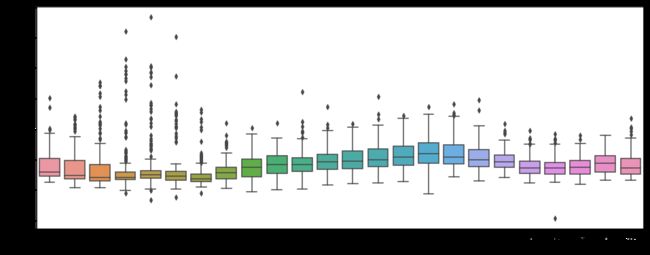
# New York City Taxi Trip Duration纽约出租车大数据探索
import numpy as np
import pandas as pd
import matplotlib.pyplot as plt
import seaborn as sns
import warnings
warnings.filterwarnings("ignore")
train=pd.read_csv(r"D:\2018_BigData\Python\Kaggle_learning\New York City Taxi Trip Duration\train.csv")
train.head()
|
id |
vendor_id |
pickup_datetime |
dropoff_datetime |
passenger_count |
pickup_longitude |
pickup_latitude |
dropoff_longitude |
dropoff_latitude |
store_and_fwd_flag |
trip_duration |
| 0 |
id2875421 |
2 |
2016-03-14 17:24:55 |
2016-03-14 17:32:30 |
1 |
-73.982155 |
40.767937 |
-73.964630 |
40.765602 |
N |
455 |
| 1 |
id2377394 |
1 |
2016-06-12 00:43:35 |
2016-06-12 00:54:38 |
1 |
-73.980415 |
40.738564 |
-73.999481 |
40.731152 |
N |
663 |
| 2 |
id3858529 |
2 |
2016-01-19 11:35:24 |
2016-01-19 12:10:48 |
1 |
-73.979027 |
40.763939 |
-74.005333 |
40.710087 |
N |
2124 |
| 3 |
id3504673 |
2 |
2016-04-06 19:32:31 |
2016-04-06 19:39:40 |
1 |
-74.010040 |
40.719971 |
-74.012268 |
40.706718 |
N |
429 |
| 4 |
id2181028 |
2 |
2016-03-26 13:30:55 |
2016-03-26 13:38:10 |
1 |
-73.973053 |
40.793209 |
-73.972923 |
40.782520 |
N |
435 |
train.info()
RangeIndex: 1458644 entries, 0 to 1458643
Data columns (total 11 columns):
id                    1458644 non-null object
vendor_id             1458644 non-null int64
pickup_datetime       1458644 non-null object
dropoff_datetime      1458644 non-null object
passenger_count       1458644 non-null int64
pickup_longitude      1458644 non-null float64
pickup_latitude       1458644 non-null float64
dropoff_longitude     1458644 non-null float64
dropoff_latitude      1458644 non-null float64
store_and_fwd_flag    1458644 non-null object
trip_duration         1458644 non-null int64
dtypes: float64(4), int64(3), object(4)
memory usage: 122.4+ MB
train.describe()
|
vendor_id |
passenger_count |
pickup_longitude |
pickup_latitude |
dropoff_longitude |
dropoff_latitude |
trip_duration |
| count |
1.458644e+06 |
1.458644e+06 |
1.458644e+06 |
1.458644e+06 |
1.458644e+06 |
1.458644e+06 |
1.458644e+06 |
| mean |
1.534950e+00 |
1.664530e+00 |
-7.397349e+01 |
4.075092e+01 |
-7.397342e+01 |
4.075180e+01 |
9.594923e+02 |
| std |
4.987772e-01 |
1.314242e+00 |
7.090186e-02 |
3.288119e-02 |
7.064327e-02 |
3.589056e-02 |
5.237432e+03 |
| min |
1.000000e+00 |
0.000000e+00 |
-1.219333e+02 |
3.435970e+01 |
-1.219333e+02 |
3.218114e+01 |
1.000000e+00 |
| 25% |
1.000000e+00 |
1.000000e+00 |
-7.399187e+01 |
4.073735e+01 |
-7.399133e+01 |
4.073588e+01 |
3.970000e+02 |
| 50% |
2.000000e+00 |
1.000000e+00 |
-7.398174e+01 |
4.075410e+01 |
-7.397975e+01 |
4.075452e+01 |
6.620000e+02 |
| 75% |
2.000000e+00 |
2.000000e+00 |
-7.396733e+01 |
4.076836e+01 |
-7.396301e+01 |
4.076981e+01 |
1.075000e+03 |
| max |
2.000000e+00 |
9.000000e+00 |
-6.133553e+01 |
5.188108e+01 |
-6.133553e+01 |
4.392103e+01 |
3.526282e+06 |
pd.set_option('display.max_columns', None)
train[["passenger_count","trip_duration"]].describe()
|
passenger_count |
trip_duration |
| count |
1.458644e+06 |
1.458644e+06 |
| mean |
1.664530e+00 |
9.594923e+02 |
| std |
1.314242e+00 |
5.237432e+03 |
| min |
0.000000e+00 |
1.000000e+00 |
| 25% |
1.000000e+00 |
3.970000e+02 |
| 50% |
1.000000e+00 |
6.620000e+02 |
| 75% |
2.000000e+00 |
1.075000e+03 |
| max |
9.000000e+00 |
3.526282e+06 |
import datetime
from datetime import datetime
train.pickup_datetime = train.pickup_datetime.apply(lambda x:datetime.strptime(x, '%Y-%m-%d %H:%M:%S'))
train["pickup_yearmonth"] = train["pickup_datetime"].map(lambda x: 100*x.year + x.month)
train.head(1)
|
id |
vendor_id |
pickup_datetime |
dropoff_datetime |
passenger_count |
pickup_longitude |
pickup_latitude |
dropoff_longitude |
dropoff_latitude |
store_and_fwd_flag |
trip_duration |
pickup_yearmonth |
| 0 |
id2875421 |
2 |
2016-03-14 17:24:55 |
2016-03-14 17:32:30 |
1 |
-73.982155 |
40.767937 |
-73.96463 |
40.765602 |
N |
455 |
201603 |
train["pickup_yearmonth"].value_counts()
201603    256189
201604    251645
201605    248487
201602    238300
201606    234316
201601    229707
Name: pickup_yearmonth, dtype: int64
train["pickup_month"] = train["pickup_datetime"].map(lambda x: x.month)
train.head(1)
|
id |
vendor_id |
pickup_datetime |
dropoff_datetime |
passenger_count |
pickup_longitude |
pickup_latitude |
dropoff_longitude |
dropoff_latitude |
store_and_fwd_flag |
trip_duration |
pickup_yearmonth |
pickup_month |
| 0 |
id2875421 |
2 |
2016-03-14 17:24:55 |
2016-03-14 17:32:30 |
1 |
-73.982155 |
40.767937 |
-73.96463 |
40.765602 |
N |
455 |
201603 |
3 |
train["pickup_week"]=train.pickup_datetime.apply(lambda x: x.weekday())
train.head(2)
|
id |
vendor_id |
pickup_datetime |
dropoff_datetime |
passenger_count |
pickup_longitude |
pickup_latitude |
dropoff_longitude |
dropoff_latitude |
store_and_fwd_flag |
trip_duration |
pickup_yearmonth |
pickup_month |
pickup_week |
| 0 |
id2875421 |
2 |
2016-03-14 17:24:55 |
2016-03-14 17:32:30 |
1 |
-73.982155 |
40.767937 |
-73.964630 |
40.765602 |
N |
455 |
201603 |
3 |
0 |
| 1 |
id2377394 |
1 |
2016-06-12 00:43:35 |
2016-06-12 00:54:38 |
1 |
-73.980415 |
40.738564 |
-73.999481 |
40.731152 |
N |
663 |
201606 |
6 |
6 |
train["pickup_day"]=train.pickup_datetime.apply(lambda x: x.day)
train.head(2)
|
id |
vendor_id |
pickup_datetime |
dropoff_datetime |
passenger_count |
pickup_longitude |
pickup_latitude |
dropoff_longitude |
dropoff_latitude |
store_and_fwd_flag |
trip_duration |
pickup_yearmonth |
pickup_month |
pickup_week |
pickup_day |
| 0 |
id2875421 |
2 |
2016-03-14 17:24:55 |
2016-03-14 17:32:30 |
1 |
-73.982155 |
40.767937 |
-73.964630 |
40.765602 |
N |
455 |
201603 |
3 |
0 |
14 |
| 1 |
id2377394 |
1 |
2016-06-12 00:43:35 |
2016-06-12 00:54:38 |
1 |
-73.980415 |
40.738564 |
-73.999481 |
40.731152 |
N |
663 |
201606 |
6 |
6 |
12 |
train["pickup_date"]=train.pickup_datetime.values.astype("datetime64[D]")
train.head(2)
|
id |
vendor_id |
pickup_datetime |
dropoff_datetime |
passenger_count |
pickup_longitude |
pickup_latitude |
dropoff_longitude |
dropoff_latitude |
store_and_fwd_flag |
trip_duration |
pickup_yearmonth |
pickup_month |
pickup_week |
pickup_day |
pickup_date |
| 0 |
id2875421 |
2 |
2016-03-14 17:24:55 |
2016-03-14 17:32:30 |
1 |
-73.982155 |
40.767937 |
-73.964630 |
40.765602 |
N |
455 |
201603 |
3 |
0 |
14 |
2016-03-14 |
| 1 |
id2377394 |
1 |
2016-06-12 00:43:35 |
2016-06-12 00:54:38 |
1 |
-73.980415 |
40.738564 |
-73.999481 |
40.731152 |
N |
663 |
201606 |
6 |
6 |
12 |
2016-06-12 |
month_trip=train.groupby(['pickup_month'])["trip_duration"].agg(["sum","mean","count"])
month_trip=month_trip.reset_index()
month_trip.head(2)
|
pickup_month |
sum |
mean |
count |
| 0 |
1 |
211875608 |
922.373319 |
229707 |
| 1 |
2 |
219433897 |
920.830453 |
238300 |
month_trip.rename(columns={'sum':'month_sum_trip_dur','mean':'month_avg_trip_dur','count':"month_trip_times"}, inplace = True)
month_trip.head(2)
|
pickup_month |
month_sum_trip_dur |
month_avg_trip_dur |
month_trip_times |
| 0 |
1 |
211875608 |
922.373319 |
229707 |
| 1 |
2 |
219433897 |
920.830453 |
238300 |
date_trip=train.groupby(['pickup_date'])["trip_duration"].agg(["sum","mean","count"])
date_trip=date_trip.reset_index()
date_trip.rename(columns={'sum':'date_sum_trip_duration','mean':'date_avg_trip_dur','count':"date_trip_times"}, inplace = True)
date_trip.head()
|
pickup_date |
date_sum_trip_duration |
date_avg_trip_dur |
date_trip_times |
| 0 |
2016-01-01 |
6593910 |
920.679978 |
7162 |
| 1 |
2016-01-02 |
5470632 |
840.084767 |
6512 |
| 2 |
2016-01-03 |
5874410 |
924.667086 |
6353 |
| 3 |
2016-01-04 |
5723773 |
851.118662 |
6725 |
| 4 |
2016-01-05 |
10484304 |
1455.344808 |
7204 |
day_trip=train.groupby(['pickup_day'])["trip_duration"].agg(["sum","mean","count"])
day_trip=day_trip.reset_index()
day_trip.rename(columns={'sum':'day_sum_trip_duration','mean':'day_avg_trip_dur','count':"day_trip_times"}, inplace = True)
day_trip.head()
|
pickup_day |
day_sum_trip_duration |
day_avg_trip_dur |
day_trip_times |
| 0 |
1 |
44656812 |
958.053978 |
46612 |
| 1 |
2 |
44354937 |
928.860299 |
47752 |
| 2 |
3 |
46806173 |
976.247221 |
47945 |
| 3 |
4 |
47050568 |
947.549451 |
49655 |
| 4 |
5 |
51193213 |
1020.272899 |
50176 |
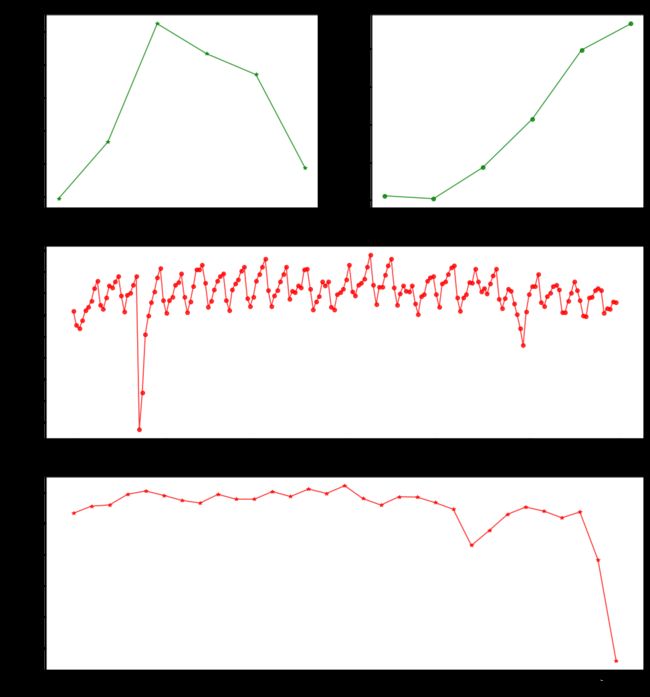
plt.figure(figsize=(16,18))
plt.subplot(321)
ax1= plt.plot(month_trip.pickup_month, month_trip.month_trip_times, color="green", alpha=0.8, label='trip times',marker='*')
plt.title("Monthly Trip Times")
plt.ylabel('# of trip times', fontsize=12)
plt.xlabel('Pickup_Month', fontsize=12)
plt.subplot(322)
ax2= plt.plot(month_trip.pickup_month, month_trip.month_avg_trip_dur, color="green",alpha=0.8,marker='o')
plt.title("Monthly Trip Duration")
plt.ylabel('Avg of trip druration', fontsize=12)
plt.xlabel('Pickup_Month', fontsize=12)
plt.subplot(312)
ax2= plt.plot(date_trip.pickup_date, date_trip.date_trip_times, color="red", alpha=0.8,marker='o')
plt.title("Date Trip Time")
plt.ylabel('Date trip time', fontsize=12)
plt.xlabel('Pickup_Date', fontsize=12)
plt.subplot(313)
ax2= plt.plot(day_trip.pickup_day, day_trip.day_trip_times, color="red", alpha=0.8,marker='*')
plt.title("Day Trip Time")
plt.ylabel('Day trip time', fontsize=12)
plt.xlabel('Pickup_Day', fontsize=12)
plt.show()
date_trip[date_trip.date_trip_times<6000]
|
pickup_date |
date_sum_trip_duration |
date_avg_trip_dur |
date_trip_times |
| 22 |
2016-01-23 |
1691754 |
1026.549757 |
1648 |
| 23 |
2016-01-24 |
3052107 |
902.189477 |
3383 |
| 150 |
2016-05-30 |
4568228 |
820.148654 |
5570 |
x = train.groupby(['pickup_day'])["passenger_count"].agg(["mean"])
x = x.reset_index()
day_trip["avg_passenger_count"] = x["mean"]
day_trip.head()
|
pickup_day |
day_sum_trip_duration |
day_avg_trip_dur |
day_trip_times |
avg_passenger_count |
| 0 |
1 |
44656812 |
958.053978 |
46612 |
1.682871 |
| 1 |
2 |
44354937 |
928.860299 |
47752 |
1.666611 |
| 2 |
3 |
46806173 |
976.247221 |
47945 |
1.655355 |
| 3 |
4 |
47050568 |
947.549451 |
49655 |
1.643279 |
| 4 |
5 |
51193213 |
1020.272899 |
50176 |
1.670301 |
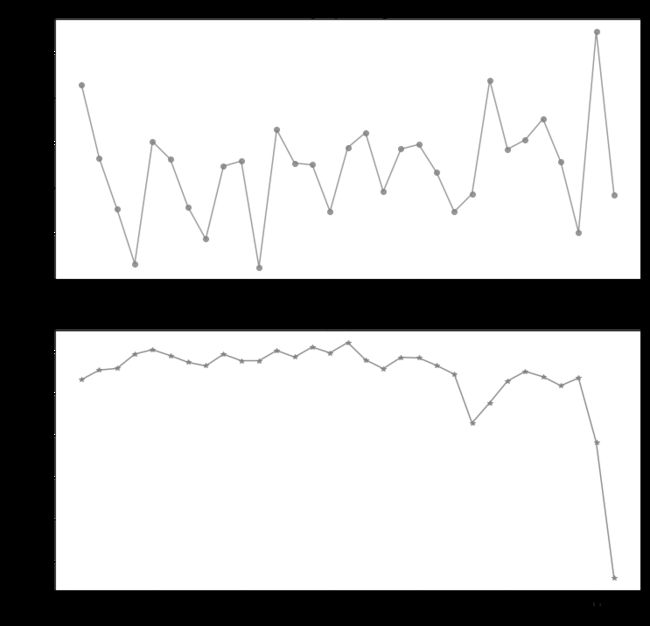
plt.figure(figsize=(12,12))
plt.subplot(211)
ax2= plt.plot(day_trip.pickup_day, day_trip.avg_passenger_count, color="grey", alpha=0.8,marker='o')
plt.title("Day Trip Passenger")
plt.ylabel('Day trip passenger', fontsize=12)
plt.xlabel('Pickup_Day', fontsize=12)
plt.subplot(212)
ax2= plt.plot(day_trip.pickup_day, day_trip.day_trip_times, color="grey", alpha=0.9,marker='*')
plt.title("Day Trip Time")
plt.ylabel('Day trip time', fontsize=12)
plt.xlabel('Pickup_Day', fontsize=12)
plt.show()
train["pickup_hour"]=train.pickup_datetime.apply(lambda x: x.hour)
train.head()
|
id |
vendor_id |
pickup_datetime |
dropoff_datetime |
passenger_count |
pickup_longitude |
pickup_latitude |
dropoff_longitude |
dropoff_latitude |
store_and_fwd_flag |
trip_duration |
pickup_yearmonth |
pickup_month |
pickup_week |
pickup_day |
pickup_date |
pickup_hour |
| 0 |
id2875421 |
2 |
2016-03-14 17:24:55 |
2016-03-14 17:32:30 |
1 |
-73.982155 |
40.767937 |
-73.964630 |
40.765602 |
N |
455 |
201603 |
3 |
0 |
14 |
2016-03-14 |
17 |
| 1 |
id2377394 |
1 |
2016-06-12 00:43:35 |
2016-06-12 00:54:38 |
1 |
-73.980415 |
40.738564 |
-73.999481 |
40.731152 |
N |
663 |
201606 |
6 |
6 |
12 |
2016-06-12 |
0 |
| 2 |
id3858529 |
2 |
2016-01-19 11:35:24 |
2016-01-19 12:10:48 |
1 |
-73.979027 |
40.763939 |
-74.005333 |
40.710087 |
N |
2124 |
201601 |
1 |
1 |
19 |
2016-01-19 |
11 |
| 3 |
id3504673 |
2 |
2016-04-06 19:32:31 |
2016-04-06 19:39:40 |
1 |
-74.010040 |
40.719971 |
-74.012268 |
40.706718 |
N |
429 |
201604 |
4 |
2 |
6 |
2016-04-06 |
19 |
| 4 |
id2181028 |
2 |
2016-03-26 13:30:55 |
2016-03-26 13:38:10 |
1 |
-73.973053 |
40.793209 |
-73.972923 |
40.782520 |
N |
435 |
201603 |
3 |
5 |
26 |
2016-03-26 |
13 |
week_trip = train.groupby(["pickup_month",'pickup_week','pickup_day','pickup_hour'])["trip_duration"].agg(["mean","count"])
week_trip = week_trip.reset_index()
week_trip.head(2)
|
pickup_month |
pickup_week |
pickup_day |
pickup_hour |
mean |
count |
| 0 |
1 |
0 |
4 |
0 |
656.771186 |
118 |
| 1 |
1 |
0 |
4 |
1 |
703.086957 |
92 |
week_trip.rename(columns={'mean':'week_avg_trip_dur','count':"week_trip_times"}, inplace = True)
print(week_trip.shape)
week_trip.head(2)
(4359, 6)
|
pickup_month |
pickup_week |
pickup_day |
pickup_hour |
week_avg_trip_dur |
week_trip_times |
| 0 |
1 |
0 |
4 |
0 |
656.771186 |
118 |
| 1 |
1 |
0 |
4 |
1 |
703.086957 |
92 |
x1 = train.groupby(["pickup_month",'pickup_week','pickup_day','pickup_hour'])["passenger_count"].agg(["mean"])
x1 = x1.reset_index()
week_trip["avg_passenger_count"] = x1["mean"]
week_trip.head()
|
pickup_month |
pickup_week |
pickup_day |
pickup_hour |
week_avg_trip_dur |
week_trip_times |
avg_passenger_count |
| 0 |
1 |
0 |
4 |
0 |
656.771186 |
118 |
1.593220 |
| 1 |
1 |
0 |
4 |
1 |
703.086957 |
92 |
1.673913 |
| 2 |
1 |
0 |
4 |
2 |
692.085106 |
47 |
1.574468 |
| 3 |
1 |
0 |
4 |
3 |
738.500000 |
32 |
1.250000 |
| 4 |
1 |
0 |
4 |
4 |
644.000000 |
50 |
1.700000 |
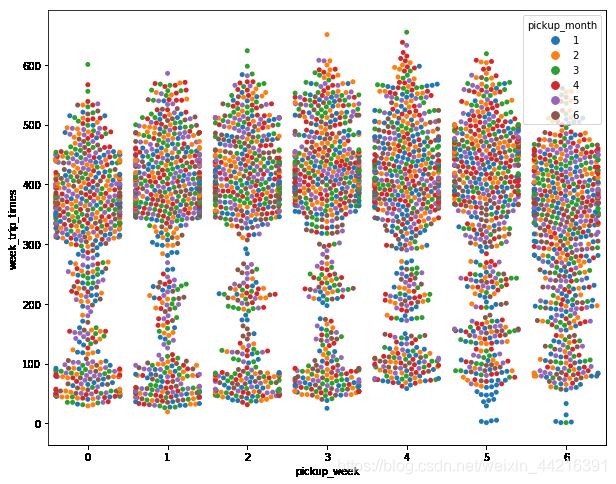
plt.figure(figsize=(10,8))
sns.swarmplot(x="pickup_week", y="week_trip_times", hue="pickup_month", data=week_trip)
plt.show()
plt.figure(figsize=(10,5))
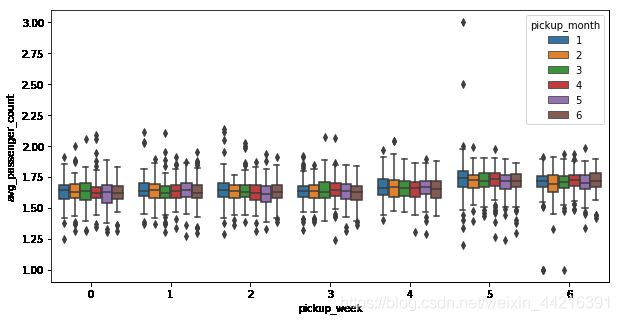
sns.boxplot(x="pickup_week", y="avg_passenger_count", hue="pickup_month", data=week_trip)
plt.show()
plt.figure(figsize=(16,6))
sns.swarmplot(x="pickup_hour", y="week_trip_times", data=week_trip)
plt.show()

plt.figure(figsize=(16,6))
sns.stripplot(x="pickup_hour", y="avg_passenger_count", data=week_trip)
plt.show()

plt.figure(figsize=(16,6))
y=week_trip["week_avg_trip_dur"][week_trip["week_avg_trip_dur"]<=8000]
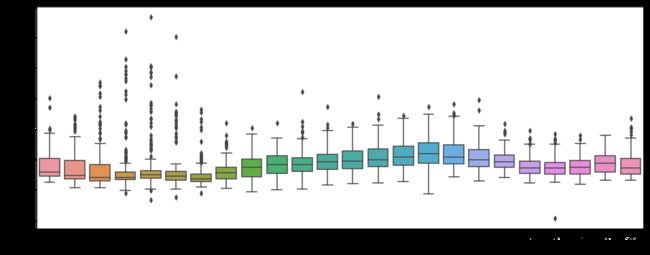
daytripdur=sns.boxplot(x="pickup_hour", y=y, data=week_trip)
plt.show()
plt.figure(figsize=(16,6))
daytripdur=sns.boxplot(x="pickup_hour", y=y, data=week_trip)
plt.show()
from math import sin,radians,cos,asin,sqrt
def haversine(lon1, lat1, lon2, lat2):
lon1, lat1, lon2, lat2 = map(radians, [lon1, lat1, lon2, lat2])
dlon = lon2 - lon1
dlat = lat2 - lat1
a = sin(dlat/2)**2 + cos(lat1) * cos(lat2) * sin(dlon/2)**2
c = 2 * asin(sqrt(a))
r = 6371
return c * r
plt.figure(figsize=(16,6))
y=week_trip["week_avg_trip_dur"][week_trip["week_avg_trip_dur"]<=8000]
daytripdur=sns.boxplot(x="pickup_hour", y=y, data=week_trip)
plt.show()
