Intel Realsense D435 python 从深度相机realsense生成pcl点云
引用文章:python 从深度相机realsense生成pcl点云
从深度相机realsense生成pcl点云
- 一、通过realsense取得深度信息和彩色信息
- 二、获取坐标和色彩信息
- 三、通过pcl可视化点云
一、通过realsense取得深度信息和彩色信息
ubuntu下intel realsense的软件可以打开realsen的界面,里面可以得到彩色图像和深度图像,我们通过realsense的python接口获取彩色信息和深度信息。
- 基础的获取彩色和深度信息,realsense中的视频流转换为python的numpy格式,通过opencv输出
import pyrealsense2 as rs
import numpy as np
import cv2
import pcl

if __name__ == "__main__":
    # Configure depth and color streams
    pipeline = rs.pipeline()
    config = rs.config()
    config.enable_stream(rs.stream.depth, 640, 480, rs.format.z16, 30)
    config.enable_stream(rs.stream.color, 640, 480, rs.format.bgr8, 30)
    # Start streaming
    pipeline.start(config)

    try:
        while True:
            # Wait for a coherent pair of frames: depth and color
            frames = pipeline.wait_for_frames()
            depth_frame = frames.get_depth_frame()
            color_frame = frames.get_color_frame()
            if not depth_frame or not color_frame:
                continue
            # Convert images to numpy arrays

            depth_image = np.asanyarray(depth_frame.get_data())
            color_image = np.asanyarray(color_frame.get_data())

            # Apply colormap on depth image (image must be converted to 8-bit per pixel first)
            depth_colormap = cv2.applyColorMap(cv2.convertScaleAbs(depth_image, alpha=0.03), cv2.COLORMAP_JET)

            # Stack both images horizontally
            images = np.hstack((color_image, depth_colormap))
            # Show images
            cv2.namedWindow('RealSense', cv2.WINDOW_AUTOSIZE)
            cv2.imshow('RealSense', images)
            key = cv2.waitKey(1)
            # Press esc or 'q' to close the image window
            if key & 0xFF == ord('q') or key == 27:
                cv2.destroyAllWindows()
                break
    finally:
        # Stop streaming
        pipeline.stop()
- 获取内参和保存图片
分别用opencv和scipy.misc保存图片,略微会有一些差异,同时我们也获取了相机参数。
import pyrealsense2 as rs
import numpy as np
import cv2
import scipy.misc
import pcl


def get_image():
    # Configure depth and color streams
    pipeline = rs.pipeline()
    config = rs.config()
    config.enable_stream(rs.stream.depth, 640, 480, rs.format.z16, 30)
    config.enable_stream(rs.stream.color, 640, 480, rs.format.bgr8, 30)
    # Start streaming
    pipeline.start(config)

    #获取图像,realsense刚启动的时候图像会有一些失真,我们保存第100帧图片。
    for i in range(100):
        data = pipeline.wait_for_frames()
        depth = data.get_depth_frame()
        color = data.get_color_frame()

    #获取内参
    dprofile = depth.get_profile()
    cprofile = color.get_profile()

    cvsprofile = rs.video_stream_profile(cprofile)
    dvsprofile = rs.video_stream_profile(dprofile)

    color_intrin=cvsprofile.get_intrinsics()
    print(color_intrin)
    depth_intrin=dvsprofile.get_intrinsics()
    print(color_intrin)
    extrin = dprofile.get_extrinsics_to(cprofile)
    print(extrin)

    depth_image = np.asanyarray(depth.get_data())
    color_image = np.asanyarray(color.get_data())

    # Apply colormap on depth image (image must be converted to 8-bit per pixel first)
    depth_colormap = cv2.applyColorMap(cv2.convertScaleAbs(depth_image, alpha=0.03), cv2.COLORMAP_JET)

    cv2.imwrite('color.png', color_image)
    cv2.imwrite('depth.png', depth_image)
    cv2.imwrite('depth_colorMAP.png', depth_colormap)
    scipy.misc.imsave('outfile1.png', depth_image)
    scipy.misc.imsave('outfile2.png', color_image)
二、获取坐标和色彩信息
- 通过realsense摄像头,获取了顶点坐标和色彩信息。具体并不是很了解,pc.mac_to() 和 points=pc.calculate()是把色彩和深度结合了? 再通过points获取顶点坐标。我们将顶点坐标和彩色相机得到的像素存入txt文件。
def my_depth_to_cloud():
    pc = rs.pointcloud()
    points = rs.points()

    pipeline = rs.pipeline()
    config = rs.config()
    config.enable_stream(rs.stream.depth, 640, 480, rs.format.z16, 30)
    config.enable_stream(rs.stream.color, 640, 480, rs.format.bgr8, 30)
    pipe_profile = pipeline.start(config)

    for i in range(100):
        data = pipeline.wait_for_frames()

        depth = data.get_depth_frame()
        color = data.get_color_frame()

    frames = pipeline.wait_for_frames()
    depth = frames.get_depth_frame()
    color = frames.get_color_frame()

    colorful = np.asanyarray(color.get_data())
    colorful=colorful.reshape(-1,3)

    pc.map_to(color)
    points = pc.calculate(depth)

    #获取顶点坐标
    vtx = np.asanyarray(points.get_vertices())
    #获取纹理坐标
    #tex = np.asanyarray(points.get_texture_coordinates())


    with open('could.txt','w') as f:
        for i in range(len(vtx)):
            f.write(str(np.float(vtx[i][0])*1000)+' '+str(np.float(vtx[i][1])*1000)+' '+str(np.float(vtx[i][2])*1000)+' '+str(np.float(colorful[i][0]))+' '+str(np.float(colorful[i][1]))+' '+str(np.float(colorful[i][2]))+'\n')
三、通过pcl可视化点云
https://github.com/strawlab/python-pcl/blob/master/examples/example.py
- 在pcl中,要显示三维加色彩的点云坐标,每个点云包含了 x,y,z,rgb四个参数,特别的,rbg这个参数是由三维彩色坐标转换过来的。刚才得到的could.txt中,x,y,z,r,g,b 转换为x,y,z,rgb,只改颜色数据np.int(data[i][3])<<16|np.int(data[i][4])<<8|np.int(data[i][5])。保存为cloud_rbg.txt
    with open('could.txt','r') as f:
        lines = f.readlines()
        num=0
        for line in lines:
            l=line.strip().split()
            data.append([np.float(l[0]),np.float(l[1]),np.float(l[2]),np.float(l[3]),np.float(l[4]),np.float(l[5])])
            #data.append([np.float(l[0]), np.float(l[1]), np.float(l[2])])
            num = num+1


    with open('cloud_rgb.txt', 'w') as f:
        for i in range(len(data)):
            f.write(str(np.float(data[i][0])) + ' ' + str(np.float(data[i][1])) + ' ' + str(np.float(data[i][2]))+ ' '  + str(np.int(data[i][3])<<16|np.int(data[i][4])<<8|np.int(data[i][5]))+'\n')
- 显示
def visual():
    cloud = pcl.PointCloud_PointXYZRGB()
    points = np.zeros((307200,4),dtype=np.float32)

    n=0
    with open('cloud_rgb.txt','r') as f:
        lines = f.readlines()
        for line in lines:
            l=line.strip().split()
            #保存xyz时候扩大了1000倍,发现并没有用
            points[n][0] = np.float(l[0])/1000
            points[n][1] = np.float(l[1])/1000
            points[n][2] = np.float(l[2])/1000
            points[n][3] = np.int(l[3])
            n=n+1

    print(points[0:100]) #看看数据是怎么样的
    cloud.from_array(points) #从array构建点云的方式

    visual = pcl.pcl_visualization.CloudViewing()
    visual.ShowColorCloud(cloud)

    v = True
    while v:
        v = not (visual.WasStopped())
- 想生成pcd,再读取pcd,但是下面的程序在可视化的时候报错
def txt2pcd():
    import time
    filename='cloud_rgb.txt'
    print("the input file name is:%r." % filename)

    start = time.time()
    print("open the file...")
    file = open(filename, "r+")
    count = 0

    # 统计源文件的点数
    for line in file:
        count = count + 1
    print("size is %d" % count)
    file.close()

    # output = open("out.pcd","w+")
    f_prefix = filename.split('.')[0]
    output_filename = '{prefix}.pcd'.format(prefix=f_prefix)
    output = open(output_filename, "w+")

    list = ['# .PCD v0.7 - Point Cloud Data file format\n', 'VERSION 0.7\n', 'FIELDS x y z rgb\n', 'SIZE 4 4 4 4\n',
            'TYPE F F F U\n', 'COUNT 1 1 1 1\n']

    output.writelines(list)
    output.write('WIDTH ')  # 注意后边有空格
    output.write(str(count))
    output.write('\nHEIGHT ')
    output.write(str(1))  # 强制类型转换,文件的输入只能是str格式
    output.write('\nPOINTS ')
    output.write(str(count))
    output.write('\nDATA ascii\n')
    file1 = open(filename, "r")
    all = file1.read()
    output.write(all)
    output.close()
    file1.close()
    end = time.time()
    print("run time is: ", end - start)


    import pcl.pcl_visualization
    cloud = pcl.load_XYZRGB('cloud_rgb.pcd')
    visual = pcl.pcl_visualization.CloudViewing()
    visual.ShowColorCloud(cloud, 'cloud')

    flag = True
    while flag:
        flag != visual.WasStopped()
# TypeError: expected bytes, str found
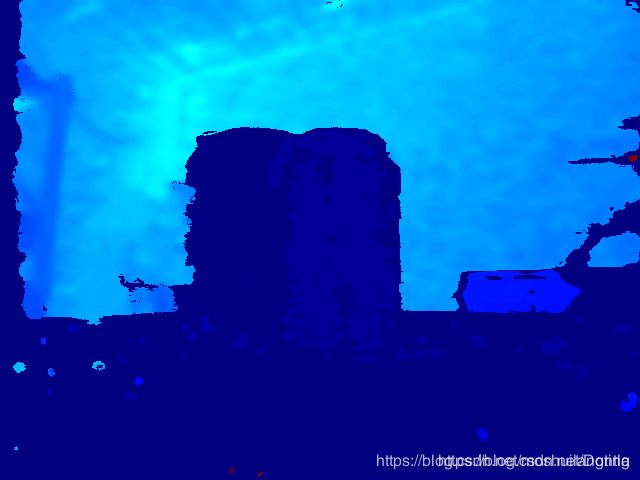
原图,深度图,云图(云图一片黑,鼠标滚轮翻一下) 如下:
opencv保存的颜色图:

scipy保存的颜色图:

深度图:

深度图可视化:

云图(似乎深度和色彩没有对齐):
