100 days of ML ---- 100天搞定机器学习(2)
这是100天搞定机器学习挑战的第二天,继续翻译,我尽量翻译的专业一点,如果我翻译的不对,请保持镇定,不要打我。
转发请注明出处。
第二天:简单线性回归
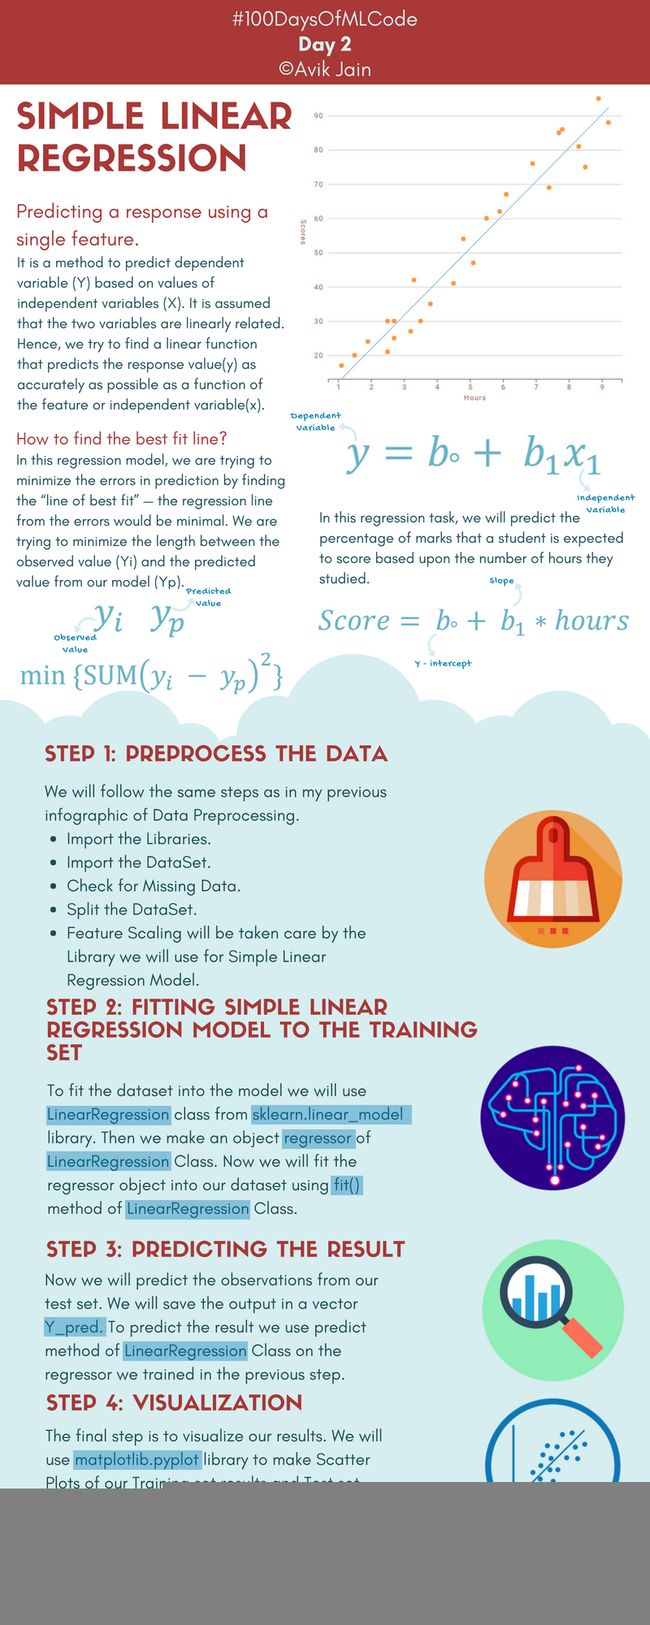
下图为作者给出的知识图谱
predicting a response using a single feature
利用单特征预测结果
it is a method to predict dependent variable (Y) based on values of independent variables(X).
它是基于自变量(x)的值来预测因变量(y)的一种方法。
It is assumed that the two variables are linearly related.
假设两个变量线性相关。
Hence,we try to find a linear function that predicts the response value(y) as accurately as possible as a function of the feature or independent variable(x)
因此,我们尝试找到一个线性函数,它尽可能准确地通过特征或自变量(x)预测值(y)。
How to find the best fit line
怎样找到最佳拟合线
in this regression model,we are trying to minimize the errors in prediction by finding the “line of best fit” – the regression line from the errors would be minimal.
在这个回归模型中,我们试图通过找到“最佳拟合线”来最小化预测误差 – 来自误差的回归线将是最小的。
We are trying to minimize the length between the observed value (Yi) and the predicted value from our model (Yp)
我们试图最小化真实值(Yi)与我们模型(Yp)预测值之间的长度
in this regression task,we will predict the percentage of marks that a student is expected to score based upon the number of hours they studied.
在这个回归任务中,我们将根据学生学习的时间数来预测学生预期分数的百分比。
Step 1: preprocess the data 第一步:处理数据
we will follow the same steps as in my previous infographic of Data Preprocessing.
我们将遵循与我以前的数据预处理的信息图表相同的步骤。
Import the Libraries
导入库
import the dataset
导入数据集
check for missing data
检测错误数据
split the dataset
划分数据集
feature scaling will be taken care by the library we will use for Simple Linear Regression Model.
我们将使用简单线性回归模型的库来进行特征缩放。
Step 2: fitting simple linear regression model to the training set
第二步:为训练训练的简单线性回归模型
to fit dataset into the model we will use linearRegression class from sklearn.linear_model library.
为了将数据集拟合到模型中,我们将使用sklearn.linear_model 库中的linearRegression 类。
Now we will fit the regressor object into our dataset using fit() method of LinearRegression class
现在我们将使用LinearRegression类的fit()方法将回归对象拟合到我们的数据集中
step 3: prediction the result 第三步:预测结果
now we will predict the observations from our test set.
现在我们将从我们的测试集中预测观察结果。
We will save the output in a vector Y_pred
我们把输出结果存储在Y_pred向量中
to predict the result we use predict method of LinearRegression class on the regressor we trained in the previous step.
为了预测结果,我们在上一步训练的回归量上使用了LinearRegression类的预测方法。
Step 4:visualization 可视化
the final step is to visualize our results
最后一步是可视化我们的结果
we will use matplotlib.pyplot library to make Scatter Plots of our Training set results and Test Set results to see how close our model predicted the Values
我们将使用matplotlib.pyplot 库来制作我们的训练集结果和测试集结果的散点图,看看我们的模型预测值有多接近。
代码如下
Step 1: Data Preprocessing 数据处理
import pandas as pd
import numpy as np
import matplotlib.pyplot as plt

dataset = pd.read_csv('studentscores.csv')
X = dataset.iloc[ : ,   : 1 ].values
Y = dataset.iloc[ : , 1 ].values

from sklearn.cross_validation import train_test_split
X_train, X_test, Y_train, Y_test = train_test_split( X, Y, test_size = 1/4, random_state = 0)
Step 2: Fitting Simple Linear Regression Model to the training set
使训练集拟合简单线性回归模型
from sklearn.linear_model import LinearRegression
regressor = LinearRegression()
regressor = regressor.fit(X_train, Y_train)
Step 3: Predecting the Result 预测结果
Y_pred = regressor.predict(X_test)Step 4: Visualization 可视化
Visualising the Training results 可视化训练集结果
plt.scatter(X_train , Y_train, color = 'red')
plt.plot(X_train , regressor.predict(X_train), color ='blue')
Visualizing the test results 可视化测试集结果
plt.scatter(X_test , Y_test, color = 'red')
plt.plot(X_test , regressor.predict(X_test), color ='blue')
写在后面
数据集要放在于编程文件要放在同一目录下,否则读取数据集时就要给出相对路径或者给出绝对路径。
在运行时会有警告,这是因为版本问题,你可以忽视,也可以使用百度或者谷歌解决,能高效使用搜索引擎也是一种能力,这里就不给出解决方案了。具体做法就是复制报错信息查找解决方法。
如果按照作者的代码原封步动的敲出来是什么都看不到的,在可视化训练集结果和可视化测试集结果的代码后面加一行
plt.show()
