Openlayer学习笔记之图标与提示信息
如何添加图标和提示信息到地图上呢?
一、应用overlay
<!Doctype html>
<html lang="ch" >
<head>
    <meta http-equiv=Content-Type content="text/html;charset=utf-8">
    <meta http-equiv=X-UA-Compatible content="IE=edge,chrome=1">
    <meta content=always name=referrer>
    <title>OpenLayers 地图示例</title>
    <link href="ol.css" rel="stylesheet" type="text/css"/>
    <script type="text/javascript" src="ol.js" charset="utf-8"></script>
</head>
<body >
<div id="map" style="width: 800px;height: 800px"></div>
<div id="anchor"><img src="美队.png" alt="示例锚点"/></div>
<script type="text/javascript">
    var map = new ol.Map({
        layers: [
            new ol.layer.Tile({
                source: new ol.source.OSM()
            })
        ],
        target: 'map',
        view: new ol.View({
            projection: 'EPSG:4326',
            center: [104, 30],
            zoom: 10
        })
    });

    // 下面把上面的图标附加到地图上,需要一个ol.Overlay
    var anchor = new ol.Overlay({
        element: document.getElementById('anchor')
    });
    // 关键的一点,需要设置附加到地图上的位置
    anchor.setPosition([104, 30]);
    // 然后添加到map上
    map.addOverlay(anchor);
</script>
</body>

</html>
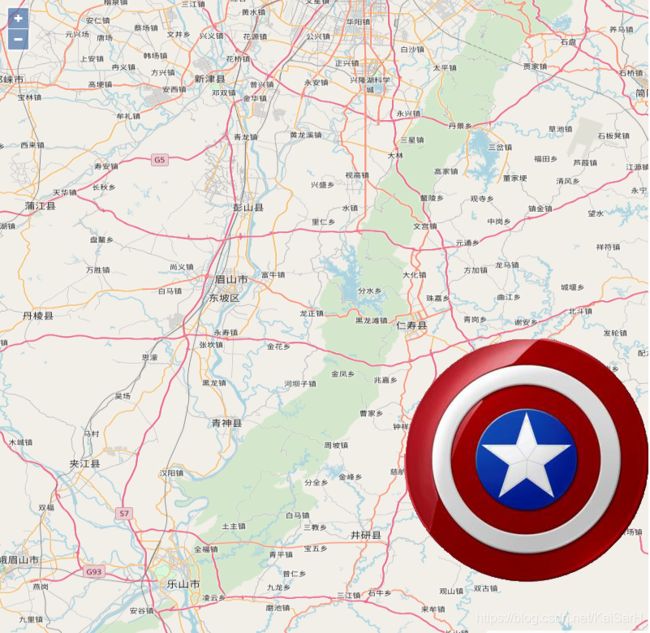
运行结果:
缺点
当图标比较多的情况下,如果采用这种方式,那么我们会加入非常多的HTML元素,从而造成效率降低。 关于效率的测试,大家可以自行测试。 为什么会这样呢? 因为界面上元素的遍历在数量比较多的情况下,会变慢,基于此基础上的渲染,鼠标事件都会变慢。
优点
这种使用传统的方式显示图标可以应用传统的HTML技术,比如鼠标移动到图标上,鼠标图标变成手势。 我们可以用css来处理就可以了,比如在head里面添加下面的代码:
<style type="text/css">
    #anchor {
        cursor:pointer;
    }
</style>
就可以看到鼠标放到锚点上去的时候,鼠标图标从箭头,变成手了。 类似的其他技术都可以应用上去,比如css动画。
<!Doctype html>
<html lang="ch" >
<head>
    <meta http-equiv=Content-Type content="text/html;charset=utf-8">
    <meta http-equiv=X-UA-Compatible content="IE=edge,chrome=1">
    <meta content=always name=referrer>
    <title>OpenLayers 地图示例</title>
    <link href="ol.css" rel="stylesheet" type="text/css"/>
    <script type="text/javascript" src="ol.js" charset="utf-8"></script>
    <!--定义动画,图标先放大,再缩小-->
    <style type="text/css">
        @keyframes zoom
        {
            from {top: 0; left: 0; width: 32px; height: 32px;}
            50% {top: -16px; left: -16px; width: 64px; height: 64px;}
            to {top: 0; left: 0; width: 32px; height: 32px;}
        }

        @-moz-keyframes zoom /* Firefox */
        {
            from {top: 0; left: 0; width: 32px; height: 32px;}
            50% {top: -16px; left: -16px; width: 64px; height: 64px;}
            to {top: 0; left: 0; width: 32px; height: 32px;}
        }

        @-webkit-keyframes zoom /* Safari 和 Chrome */
        {
            from {top: 0; left: 0; width: 32px; height: 32px;}
            50% {top: -16px; left: -16px; width: 64px; height: 64px;}
            to {top: 0; left: 0; width: 32px; height: 32px;}
        }

        @-o-keyframes zoom /* Opera */
        {
            from {top: 0; left: 0; width: 32px; height: 32px;}
            50% {top: -16px; left: -16px; width: 64px; height: 64px;}
            to {top: 0; left: 0; width: 32px; height: 32px;}
        }

        /* 应用css动画到图标元素上 */
        #anchorImg
        {
            display: block;
            position: absolute;
            animation: zoom 5s;
            animation-iteration-count: infinite; /* 一直重复动画 */
            -moz-animation: zoom 5s; /* Firefox */
            -moz-animation-iteration-count: infinite; /* 一直重复动画 */
            -webkit-animation: zoom 5s;  /* Safari 和 Chrome */
            -webkit-animation-iteration-count: infinite; /* 一直重复动画 */
            -o-animation: zoom 5s; /* Opera */
            -o-animation-iteration-count: infinite; /* 一直重复动画 */
        }
    </style>
</head>
<body >
<div id="map" style="width: 800px;height: 800px"></div>
<div id="anchor" style="width: 64px;height: 64px;" ><img id='anchorImg' src="美队.png" alt="示例锚点"/></div>
<script type="text/javascript">
    var map = new ol.Map({
        layers: [
            new ol.layer.Tile({
                source: new ol.source.OSM()
            })
        ],
        target: 'map',
        view: new ol.View({
            projection: 'EPSG:4326',
            center: [104, 30],
            zoom: 10
        })
    });

    var anchor = new ol.Overlay({
        element: document.getElementById('anchor')
    });
    anchor.setPosition([104, 30]);
    map.addOverlay(anchor);
</script>
</body>

</html>
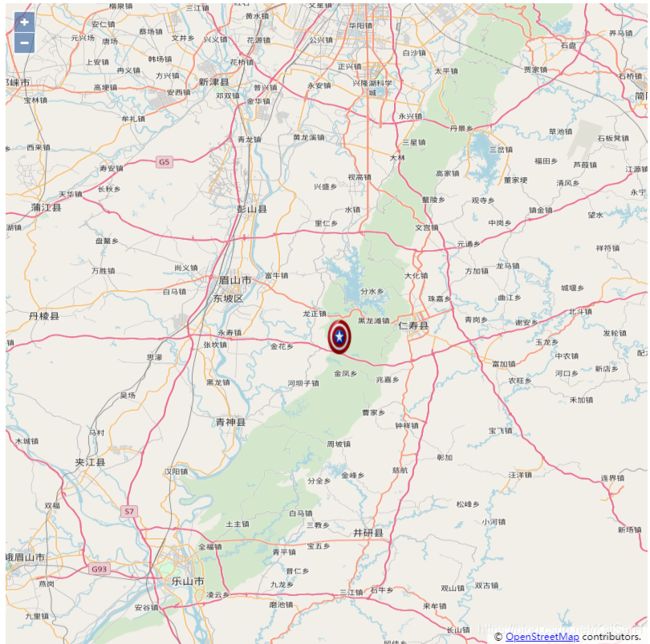
这一段代码就实现了图片的大小缩放动画效果
一、style及应用
我们同样可以通过Feature+style设置图标的样式
<!Doctype html>
<html lang="ch" >
<head>
    <meta http-equiv=Content-Type content="text/html;charset=utf-8">
    <meta http-equiv=X-UA-Compatible content="IE=edge,chrome=1">
    <meta content=always name=referrer>
    <title>OpenLayers 地图示例</title>
    <link href="ol.css" rel="stylesheet" type="text/css"/>
    <script type="text/javascript" src="ol.js" charset="utf-8"></script>
</head>
<body >
<div id="map" style="width: 800px;height: 800px"></div>
<script type="text/javascript">
    // 我们需要一个vector的layer来放置图标
    var layer = new ol.layer.Vector({
        source: new ol.source.Vector()
    })

    var map = new ol.Map({
        layers: [
            new ol.layer.Tile({
                source: new ol.source.OSM()
            }),
            layer
        ],
        target: 'map',
        view: new ol.View({
            projection: 'EPSG:4326',
            center: [104, 30],
            zoom: 10
        })
    });

    // 创建一个Feature,并设置好在地图上的位置
    var anchor = new ol.Feature({
        geometry: new ol.geom.Point([104, 30])
    });
    // 设置样式,在样式中就可以设置图标
    anchor.setStyle(new ol.style.Style({
        image: new ol.style.Icon({
            src: '美队.png'
        })
    }));
    // 添加到之前的创建的layer中去
    layer.getSource().addFeature(anchor);
</script>
</body>

</html>

效果与之前的使用overlay是完全一样的,但从代码上来看,是不一样的:
- 首先overlay需要HTML元素img,但这种方式不需要
- overlay是添加在map上的,但是这种方式需要一个Vector的layer,并添加在其上
- 没有办法像overlay那样使用一些HTML技术
设置图标位置
image: new ol.style.Icon({
  src: '美队.png',
  anchor: [0.5, 1]    // 设置图标位置
})
\默认情况下,位置坐标是按照比例的方式来设置的,范围从0到1,x轴上0表示最左边,1表示最右边,y轴上0表示最上边,1表示最下边。 如代码所示,x设置为0.5可以让图片在x方向上居中,y设置为1可以让图片在y方向上移动到最底端。
除了按照比例进行移动之外,还可以按照像素来计算位置,但必须显示设置anchorXUnits或 anchorYUnits为pixels。 根据不同的需要,可以采用不同的单位来设置。
根据层级放大缩小图标
<div id="map" style="width: 100%"></div>
<script type="text/javascript">
  var layer = new ol.layer.Vector({
    source: new ol.source.Vector()
  })
  var map = new ol.Map({
    layers: [
      new ol.layer.Tile({
        source: new ol.source.OSM()
      }),
      layer
    ],
    target: 'map',
    view: new ol.View({
      projection: 'EPSG:4326',
      center: [104, 30],
      zoom: 10
    })
  });

  var anchor = new ol.Feature({
    geometry: new ol.geom.Point([104, 30])
  });
  anchor.setStyle(new ol.style.Style({
    image: new ol.style.Icon({
      src: '美队.png'
    })
  }));
  layer.getSource().addFeature(anchor);

  // 监听地图层级变化
  map.getView().on('change:resolution', function(){
      var style = anchor.getStyle();
      // 重新设置图标的缩放率,基于层级10来做缩放
      style.getImage().setScale(this.getZoom() / 10);
      anchor.setStyle(style);
  })
</script>
设置SVG图标
<div id="map" style="width: 100%"></div>
<script type="text/javascript">
var layer = new ol.layer.Vector({
source: new ol.source.Vector()
})
var map = new ol.Map({
layers: [
new ol.layer.Tile({
source: new ol.source.OSM()
}),
layer
],
target: 'map',
view: new ol.View({
projection: 'EPSG:4326',
center: [104, 30],
zoom: 10
})
});
var anchor = new ol.Feature({
geometry: new ol.geom.Point([104, 30])
});
// 构建svg的Image对象
var svg = '+
'前半部分代码都一样,最后设置样式的时候,可以根据注释来理解不一样的代码,构建Image对象,设置src是关键。
规则几何体图标
<div id="map" style="width: 100%"></div>
<script type="text/javascript">
  var layer = new ol.layer.Vector({
    source: new ol.source.Vector()
  })
  var map = new ol.Map({
    layers: [
      new ol.layer.Tile({
        source: new ol.source.OSM()
      }),
      layer
    ],
    target: 'map',
    view: new ol.View({
      projection: 'EPSG:4326',
      center: [104, 30],
      zoom: 10
    })
  });

  // 添加一个三角形
  var shape = new ol.Feature({
    geometry: new ol.geom.Point([104, 30])
  });
  shape.setStyle(new ol.style.Style({
    image: new ol.style.RegularShape({
      points: 3,    // 顶点数
      radius: 10,    // 图形大小,单位为像素
      stroke: new ol.style.Stroke({ // 设置边的样式
          color: 'red',
          size: 2
      })
    })
  }));

  layer.getSource().addFeature(shape);

  // 添加一个五星
    var star = new ol.Feature({
    geometry: new ol.geom.Point([104.1, 30.1])
  });
  star.setStyle(new ol.style.Style({
    image: new ol.style.RegularShape({
      points: 5,    // 顶点个数
      radius1: 20, // 外圈大小
      radius2: 10, // 内圈大小
      stroke: new ol.style.Stroke({ // 设置边的样式
          color: 'red',
          size: 2
      }),
      fill: new ol.style.Fill({ // 设置五星填充样式
          color: 'blue'
      })
    })
  }));

  layer.getSource().addFeature(star);

</script>
利用Canvas自绘图标
<div id="map" style="width: 100%"></div>
<script type="text/javascript">
  var layer = new ol.layer.Vector({
    source: new ol.source.Vector()
  })
  var map = new ol.Map({
    layers: [
      new ol.layer.Tile({
        source: new ol.source.OSM()
      }),
      layer
    ],
    target: 'map',
    view: new ol.View({
      projection: 'EPSG:4326',
      center: [104, 30],
      zoom: 10
    })
  });

  // 使用canvas绘制一个不规则几何图形
    var canvas =document.createElement('canvas');
    canvas.width = 20;
  canvas.height = 20;
    var context = canvas.getContext("2d");
    context.strokeStyle = "red";
  context.lineWidth = 1;
  context.beginPath();
  context.moveTo(0, 0);
  context.lineTo(20, 10);
  context.lineTo(0, 20);
  context.lineTo(10, 10);
  context.lineTo(0, 0);
  context.stroke();

  // 把绘制了的canvas设置到style里面
    var style = new ol.style.Style({
        image: new ol.style.Icon({
          img: canvas,
          imgSize: [canvas.width, canvas.height],
          rotation: 90 * Math.PI / 180
        })
    });

    // 创建一个Feature
  var shape = new ol.Feature({
    geometry: new ol.geom.Point([104, 30])
  });

  // 应用具有不规则几何图形的样式到Feature
  shape.setStyle(style);
  layer.getSource().addFeature(shape);
</script>
动态改变图标
<div id="map" style="width: 100%"></div>
<script type="text/javascript">
  var layer = new ol.layer.Vector({
    source: new ol.source.Vector()
  })
  var map = new ol.Map({
    layers: [
      new ol.layer.Tile({
        source: new ol.source.OSM()
      }),
      layer
    ],
    target: 'map',
    view: new ol.View({
      projection: 'EPSG:4326',
      center: [104, 30],
      zoom: 10
    })
  });

  // 添加一个空心的五星
    var star = new ol.Feature({
    geometry: new ol.geom.Point([104, 30])
  });
  star.setStyle(new ol.style.Style({
    image: new ol.style.RegularShape({
      points: 5,
      radius1: 20,
      radius2: 10,
      stroke: new ol.style.Stroke({
          color: 'red',
          size: 2
      })
    })
  }));

  layer.getSource().addFeature(star);

  // 监听地图点击事件
  map.on('click', function(event){
      var feature = map.forEachFeatureAtPixel(event.pixel, function(feature){
          return feature;
      });
      if (feature) {
          // 将空心五星为红色实心五星
          var style = feature.getStyle().getImage();
          feature.setStyle(new ol.style.Style({
            image: new ol.style.RegularShape({
              points: 5,
                  radius1: 20,
                  radius2: 10,
                  stroke: style.getStroke(),
                  fill: new ol.style.Fill({
                      color: 'red'
                  })
            })
          }));
      }
  });

</script>
文字标注
<div id="map" style="width: 100%"></div>
<script type="text/javascript">
  var layer = new ol.layer.Vector({
    source: new ol.source.Vector()
  })
  var map = new ol.Map({
    layers: [
      new ol.layer.Tile({
        source: new ol.source.OSM()
      }),
      layer
    ],
    target: 'map',
    view: new ol.View({
      projection: 'EPSG:4326',
      center: [104.06, 30.67],
      zoom: 10
    })
  });

  var anchor = new ol.Feature({
    geometry: new ol.geom.Point([104.06, 30.67])
  });
  // 设置文字style
  anchor.setStyle(new ol.style.Style({
    text: new ol.style.Text({
      // font: '10px sans-serif' 默认这个字体,可以修改成其他的,格式和css的字体设置一样
      text: '淡叔所在地成都',
      fill: new ol.style.Fill({
          color: 'red'
      })
    })
  }));
  layer.getSource().addFeature(anchor);
</script>
styleFunction应用
我们可以通过预先设定stylefunction进行判断来设置样式
<div id="map" style="width: 100%"></div>
<script type="text/javascript">
  var layer = new ol.layer.Vector({
    source: new ol.source.Vector()
  })
  var map = new ol.Map({
    layers: [
      new ol.layer.Tile({
        source: new ol.source.OSM()
      }),
      layer
    ],
    target: 'map',
    view: new ol.View({
      projection: 'EPSG:4326',
      center: [104, 30],
      zoom: 10
    })
  });

  var anchor = new ol.Feature({
    geometry: new ol.geom.Point([104, 30])
  });
  // 应用style function,动态的获取样式
  anchor.setStyle(function(resolution){
      return [new ol.style.Style({
          image: new ol.style.Icon({
            src: '../img/anchor.png',
            scale: map.getView().getZoom() / 10
          })
        })];
  });

  layer.getSource().addFeature(anchor);
</script>
<div id="map2" style="width: 100%"></div>
<script type="text/javascript">

  // 创建layer使用的style function,根据feature的自定义type,返回不同的样式
  var layerStyleFunction = function(feature, resolution) {
    var type = feature.get('type');
    var style = null;
    // 点
    if (type === 'point') {
      style = new ol.style.Style({
        image: new ol.style.Circle({
          radius: 1,
          fill: new ol.style.Fill({
            color: 'red'
          })
        })
      });
    } else if ( type === 'circle') { // 圆形
      style = new ol.style.Style({
        image: new ol.style.Circle({
          radius: 10,
          stroke: new ol.style.Stroke({
            color: 'red',
            size: 1
          })
        })
      });
    } else { // 其他形状
      style = new ol.style.Style({
        image: new ol.style.RegularShape({
          points: 5,
          radius: 10,
          fill: new ol.style.Fill({
            color: 'blue'
          })
        })
      });
    }

    // 返回 style 数组
    return [style];
  };

  var layer2 = new ol.layer.Vector({
    source: new ol.source.Vector(),
    style: layerStyleFunction // 应用上面创建的 style function
  });

  var map2 = new ol.Map({
    layers: [
      new ol.layer.Tile({
        source: new ol.source.OSM()
      }),
      layer2
    ],
    target: 'map2',
    view: new ol.View({
      projection: 'EPSG:4326',
      center: [104, 30],
      zoom: 10
    })
  });

  // 添加三个feature,并设置自定义属性 type
  var rect = new ol.Feature({
    geometry: new ol.geom.Point([104, 30])
  });
  layer2.getSource().addFeature(rect);

  var circle = new ol.Feature({
    geometry: new ol.geom.Point([104, 30])
  });
  circle.set('type', 'circle');
  layer2.getSource().addFeature(circle);

  var point = new ol.Feature({
    geometry: new ol.geom.Point([104, 30])
  });
  point.set('type', 'point');
  layer2.getSource().addFeature(point);

</script>