交互式绘图
library(rCharts)
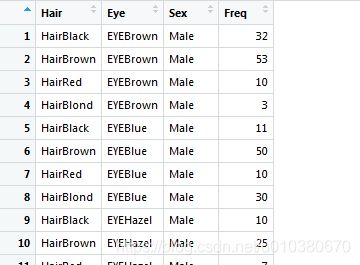
hair_eye_male <- subset(as.data.frame(HairEyeColor),Sex=="Male")
hair_eye_male[,1] <- paste0("Hair",hair_eye_male[,1])
hair_eye_male[,2] <- paste0("EYE",hair_eye_male[,2])
nPlot(Freq~Hair,group="Eye",data = hair_eye_male,type="multiBarChart")


nPlot(Freq~Hair,group="Eye",data = hair_eye_male,type="multiBarHorizontalChart")


hPlot
a <- hPlot(Pulse~Height,data=MASS::survey,type="scatter",group="Sex",
           radius = 4,group.na = "Not Available")
a$colors("rgba(223,86,76,.5)","rgba(119,152,198,.5)","rgba(60,179,113,.5)")
a$legend(align="right",verticalAlign="top",layout="vertical")
a$chart(zoomType="xy")
a$exporting(enabled=T)
a

mPlot
时间序列线图
data("economics")
dat <- transform(economics,date=as.character(date))
pl <- mPlot(x="date",y="psavert",data = dat,type="Line",
            pointsize=0.2,linewidth=0.5)
pl

pl$set(type="Area")
