RANSAC随机抽样一致学习笔记(二)
参考:1.http://en.wikipedia.org/wiki/ransac 2.整理记录
五、应用
1.应用领域:
计算机视觉领域和数学领域,例如直线拟合、平面拟合、计算图像或点云间的变换矩阵、计算基础矩阵等方面。
2.matlab应用实例:
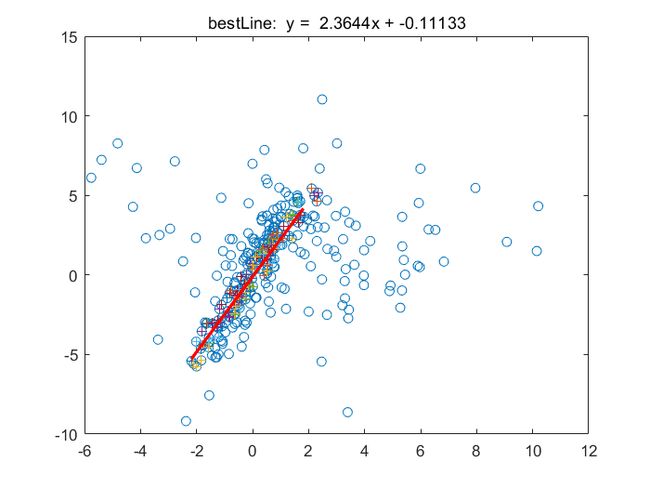
- 2D直线拟合
clear;clc;close all;

%% Generate random data for test
%inliers
mu=[0 0 ];  %mean value
S=[1 2.5;2.5 8];  %covariance
data1=mvnrnd(mu,S,200); %generate 200 gaussian distribution data
%outliers
mu=[2 2];
S=[8 0;0 8];            %covariance
data2=mvnrnd(mu,S,100); %generate 100 random distribution data
%merge
data=[data1',data2'];
iter = 100;

%% Plot data
figure;plot(data(1,:),data(2,:),'o');hold on;
number = size(data,2);
bestParameter1=0; bestParameter2=0;
sigma = 1;
pretotal=0;

for i=1:iter
    %% Randomly select 2 points
    idx = randperm(number,2);
    sample = data(:,idx);

    %% fitting line  y=kx+b
    line = zeros(1,3);
    x = sample(:, 1);
    y = sample(:, 2);

    k=(y(1)-y(2))/(x(1)-x(2));
    b = y(1) - k*x(1);
    line = [k -1 b];

    distance=abs(line*[data; ones(1,size(data,2))]);    %distance
    total=sum(distancepretotal
        pretotal=total;
        bestline=line;
    end
end
%% Plot inliers
mask=abs(bestline*[data; ones(1,size(data,2))]) - 3D直线拟合
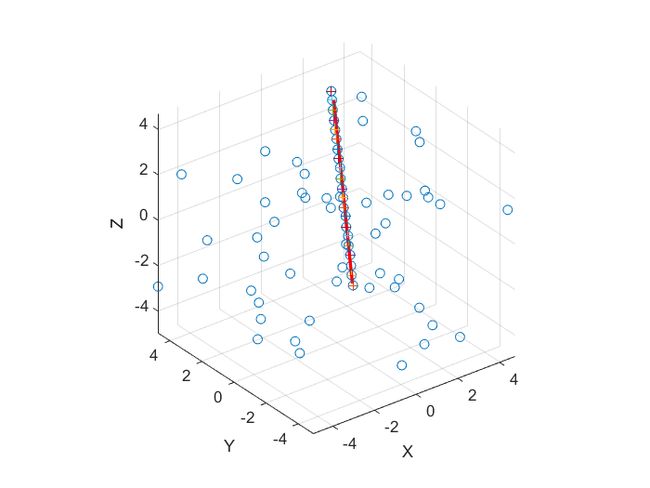
clear;clc;close all;

%% Generate random data for test
% inliers
% space linear:point: [1,1,1],Direction Vector:[1,2,3]
lineData=bsxfun(@plus, [1,1,1], (-1:0.1:1).'*[1,2,3]);
Noise1=rand(size(lineData))*0.05;
data1=(lineData+Noise1).';
% outliers
data2 = 5*(2*rand(3,50)-1);
data=[data1 data2];

%% Plot data
figure;plot3(data(1,:),data(2,:),data(3,:),'o');hold on;
grid on;axis equal;

number = size(data,2);
bestParameter = zeros(1,6);% bestParameter
sigma = 0.1;
bestInNum=0;     %best inliers number
distance=zeros(1,number);
iter = 100;

for i=1:iter
    %% Randomly select 2 points
    idx = randperm(number,2);
    sample = data(:,idx);

    P1 = sample(:, 1);
    P2 = sample(:, 2);

    %% distance from point to the line
    for i=1:number
        P0=data(:,i);
        distance(1,i)=norm(cross(P2-P1,P0-01))/norm(02-01);
    end
    %% caculate inlier number
    mask=distancebestInNum
        bestInNum=total;
        %% Calculate the linear parametric equation (x-x0)/a=(y-y0)/b=(z-z0)/c
        x0=P1(1);y0=P1(2);z0=P1(3);
        a=P2(1)-P1(1);b=P2(2)-P1(2);c=P2(3)-P1(3);
        %% Updata Parameters
        bestParameter= [x0 y0 z0 a b c];
        bestmask=mask;
    end
end
%% Plot inliers
k=1;
for i=1:length(bestmask)
    if bestmask(i)
        inliers(1,k) = data(1,i);
        k=k+1;
        plot3(data(1,i),data(2,i),data(3,i),'+');
    end
end

%% Plot line
x0=bestParameter(1)
y0=bestParameter(2)
z0=bestParameter(3)
a=bestParameter(4)
b=bestParameter(5)
c=bestParameter(6)

x1Axis=min(inliers(1,:));
y1Axis=b/a*(x1Axis-x0)+y0;
z1Axis=c/a*(x1Axis-x0)+z0;

x2Axis=max(inliers(1,:));
y2Axis=b/a*(x2Axis-x0)+y0;
z2Axis=c/a*(x2Axis-x0)+z0;

plot3([x1Axis,x2Axis],[y1Axis,y2Axis],[z1Axis,z2Axis],'r-','LineWidth',2);
xlabel('X');ylabel('Y');zlabel('Z'); - 平面拟合
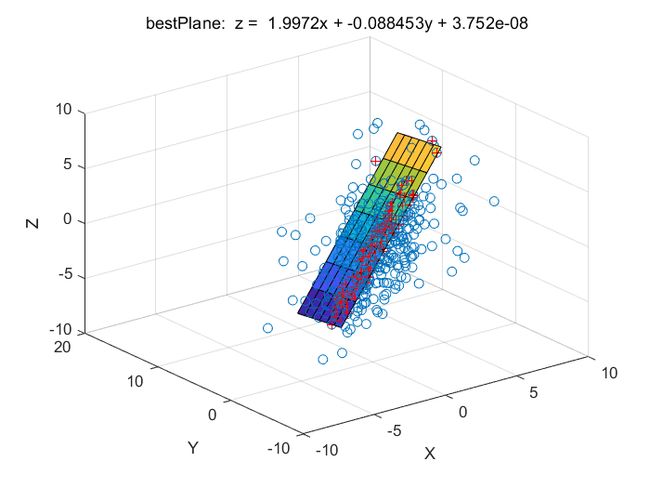
clear;clc;close all;

%% Generate random data for test
%inlines
mu=[0 0 0];  %mean
S=[2 0 4;0 4 0;4 0 8];  %covariance
data1=mvnrnd(mu,S,300);   %generate 300 gaussian distribution data
%outlines
mu=[2 2 2];
S=[8 1 4;1 8 2;4 2 8];  %covariance
data2=mvnrnd(mu,S,100);     %generate 100 random distribution data
%merge
data=[data1',data2'];

%% Plot dtat
figure;plot3(data(1,:),data(2,:),data(3,:),'o');hold on;

number = size(data,2); % number of the point
bestParameter1=0; bestParameter2=0; bestParameter3=0; % bestfitting Parameter
sigma = 0.1;
bestInNum=0;
iter = 1000;

for i=1:iter
    %% Randomly select 3 points
    idx = randperm(number,3);
    sample = data(:,idx);

    %% plane: z=ax+by+c
    plane = zeros(1,3);
    x = sample(:, 1);
    y = sample(:, 2);
    z = sample(:, 3);

    a = ((z(1)-z(2))*(y(1)-y(3)) - (z(1)-z(3))*(y(1)-y(2)))/((x(1)-x(2))*(y(1)-y(3)) - (x(1)-x(3))*(y(1)-y(2)));
    b = ((z(1) - z(3)) - a * (x(1) - x(3)))/(y(1)-y(3));
    c = z(1) - a * x(1) - b * y(1);
    plane = [a b -1 c];

    %% Compute the distances between all points with the fitting plane
    distance=abs(plane*[data; ones(1,size(data,2))]);

    %% Compute the inliers with distances smaller than the threshold
    total=sum(distancebestInNum            %find the plane with the most inlines point
        bestInNum=total;
        bestplane=plane;
    end
end
%% Plot the best fitting point
mask=abs(bestplane*[data; ones(1,size(data,2))])


