pycharm中使用tensorboard可视化
问题描述:学习tensorflow可视化时候要使用tensorboard,但是我只在pycharm中有tensorboard,没有安装其他的。所以想通过pycharm中调用tensorboard进行可视化操作。
过程如下:
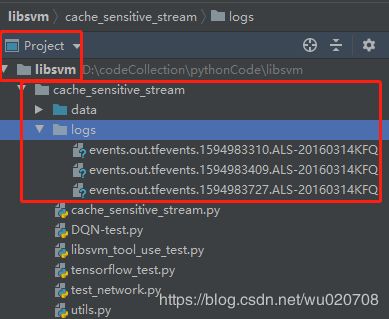
准备:把下面的代码拷贝到自己的文件中,运行,生成对应的logs文件夹,然后操作如下:
一、先了解下文件的路径:
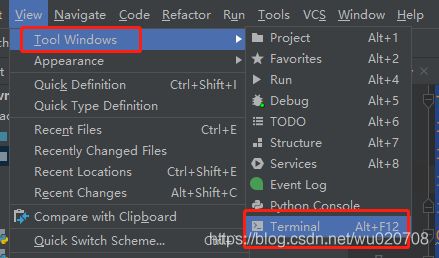
二、在pycharm中打开terminal:(两种方法)

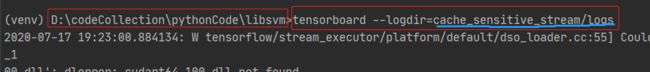
三、使用tensorboard:(一定要注意目录,和上图中的项目目录结构做下对比)
四、在浏览器中打开:
这是我terminal输入命令后结果,然后在浏览器中输入:http://localhost:6006/
TensorBoard 1.15.0 at http://ALS-20160314KFQ:6006/ (Press CTRL+C to quit)
tensorflow中的学习代码来自:
https://github.com/MorvanZhou/tutorials
https://morvanzhou.github.io/tutorials/machine-learning/tensorflow/4-1-tensorboard1/
代码,运行该代码会生成对应的logs文件:
from __future__ import print_function
import tensorflow as tf
import numpy as np
import matplotlib.pyplot as plt
import tensorboard as tb
def add_layer(inputs, in_size, out_size, activation_function=None) :
    """
    :param inputs: 输入数据
    :param in_size: 输入特征值个数
    :param out_size: 输出个数
    :param activation_function:损失函数
    :return:
    """
    with tf.name_scope('layer'):
        with tf.name_scope('weights'):
            Weights = tf.Variable(tf.random_normal([in_size, out_size]))
        # biases不建议为0
        with tf.name_scope('biases'):
            biases = tf.Variable(tf.zeros([1, out_size]) + 0.1)
        with tf.name_scope('Wx_plus_b'):
            Wx_plus_b = tf.add(tf.matmul(inputs, Weights), biases)
        if activation_function is None:
            outputs = Wx_plus_b
        else:
            outputs = activation_function(Wx_plus_b, )
        return outputs

def construct_nural_net() :
    #make data 生成300行1列的二维数组x_data
    x_data = np.linspace(-1,1,300)[:, np.newaxis]
    noise = np.random.normal(0,0.05, x_data.shape)
    y_data = np.square(x_data) - 0.5 + noise

    #define placeholder or input to network 1代表特征值个数
    with tf.name_scope('input'):
        xs = tf.placeholder(tf.float32, [None, 1])
        ys = tf.placeholder(tf.float32, [None, 1])
    #add hidden layer
    layer_one = add_layer(xs, 1, 10, activation_function= tf.nn.relu6)
    #add output layer
    prediction = add_layer(layer_one, 10, 1, activation_function=None)

    #the error between prediction and real data
    with tf.name_scope('loss'):
        loss = tf.reduce_mean(tf.reduce_sum(tf.square(ys - prediction),
                                        reduction_indices=[1]))
    with tf.name_scope('train'):
        train_step = tf.train.GradientDescentOptimizer(0.1).minimize(loss)

    sess = tf.Session()

    writer = tf.summary.FileWriter('logs/', sess.graph)
    init = tf.global_variables_initializer()
    sess.run(init)

""" #plot the real data可视化的部分代码
    fig = plt.figure()
    ax = fig.add_subplot(1,1,1)
    ax.scatter(x_data,y_data)
    #plt.ion()用于连续显示
    plt.ion()
    plt.show()

    for i in range(1000):
        sess.run(train_step, feed_dict={xs: x_data, ys: y_data})
        if i % 50 == 0:
            try:
                ax.lines.remove(lines[0])
            except Exception:
                pass
            prediction_value = sess.run(prediction, feed_dict={xs: x_data})
            lines = ax.plot(x_data, prediction_value, 'r-', lw=5)
            plt.pause(1)
            #print(sess.run(loss, feed_dict={xs: x_data, ys: y_data}))

    """

if __name__ == '__main__' :

    construct_nural_net()