Tensorflow2.0学习笔记------Cifar10
承接上文的MNIST的练手,本文再来练习卷积神经网络实现cifar10的分类,环境还是在colab是安装的tensorflow。不会用colab的可以看我之前博客https://blog.csdn.net/hesongzefairy/article/details/105411219
Step1:国际惯例加载tensorflow
import tensorflow as tf
from tensorflow.keras import datasets, layers, models
import matplotlib.pyplot as plt
Step2:加载数据集(已经集成到tf中,直接调用方法加载)
CIFAR10数据集包含60000张彩色图像,共10类,平均每类6000张图,图像大小是(32, 32)另外加载数据集已经做好了切分,训练集50000张,测试集10000张。
(train_images, train_labels), (test_images, test_labels) = datasets.cifar10.load_data()

# 归一化处理
train_images, test_images = train_images / 255.0, test_images / 255.0
Step3:查看数据集内容
把前10张图打印出来瞧瞧
class_names = ['airplane', 'automobile', 'bird', 'cat', 'deer',
               'dog', 'frog', 'horse', 'ship', 'truck']

plt.figure(figsize=(10,10))
for i in range(10):
    plt.subplot(5,5,i+1)
    plt.xticks([])
    plt.yticks([])
    plt.grid(False)
    plt.imshow(train_images[i], cmap=plt.cm.binary)
    plt.xlabel(class_names[train_labels[i][0]])
plt.show()
Step4:搭建模型并设置训练流程
卷积神经网络CNN接收数据的shape为(height,width,channel),不用考虑batch_size ,对于channel来说,RGB彩图就channel=3,mnist的灰度图像channel=1。
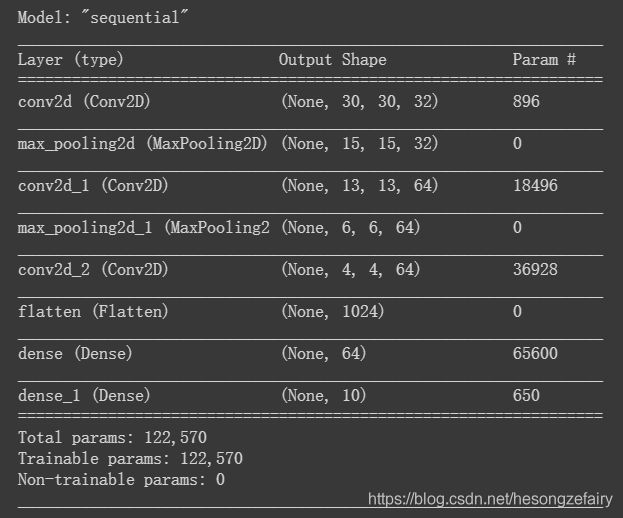
这里使用了三层2D卷积层,随着网络的深入,特征图尺寸变小可以添加更多的卷积层通道数,32增加到64。
model = models.Sequential()
model.add(layers.Conv2D(32, (3, 3), activation='relu', input_shape=(32, 32, 3)))
model.add(layers.MaxPooling2D((2, 2)))
model.add(layers.Conv2D(64, (3, 3), activation='relu'))
model.add(layers.MaxPooling2D((2, 2)))
model.add(layers.Conv2D(64, (3, 3), activation='relu'))

# 添加分类器
model.add(layers.Flatten())
model.add(layers.Dense(64, activation='relu'))
model.add(layers.Dense(10))

model.compile(optimizer='adam',
              loss=tf.keras.losses.SparseCategoricalCrossentropy(from_logits=True),
              metrics=['accuracy'])
显示一下网络结构
model.summary()Step5:启动训练并评估模型
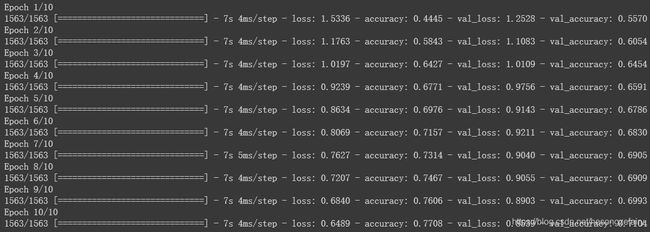
history = model.fit(train_images, train_labels, epochs=10,
                    validation_data=(test_images, test_labels))
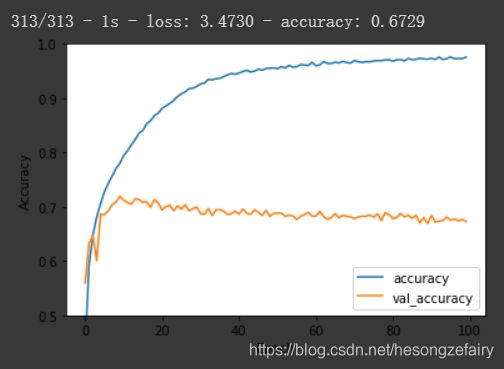
Step6:测试模型并绘制loss图(history的使用)
plt.plot(history.history['accuracy'], label='accuracy')
plt.plot(history.history['val_accuracy'], label = 'val_accuracy')
plt.xlabel('Epoch')
plt.ylabel('Accuracy')
plt.ylim([0.5, 1])
plt.legend(loc='lower right')

test_loss, test_acc = model.evaluate(test_images,  test_labels, verbose=2)
print(test_acc)


